GRAViMAG
Web interface
GRAViMAG\(^2\) is a web-based application for the processing and interpretation of potential data:
gravity
magnetic
self-potential data.
The GRAViMAG\(^2\) software is opened in a web browser. Simply point the browser to the relevant url. Then, a start screen should be shown:
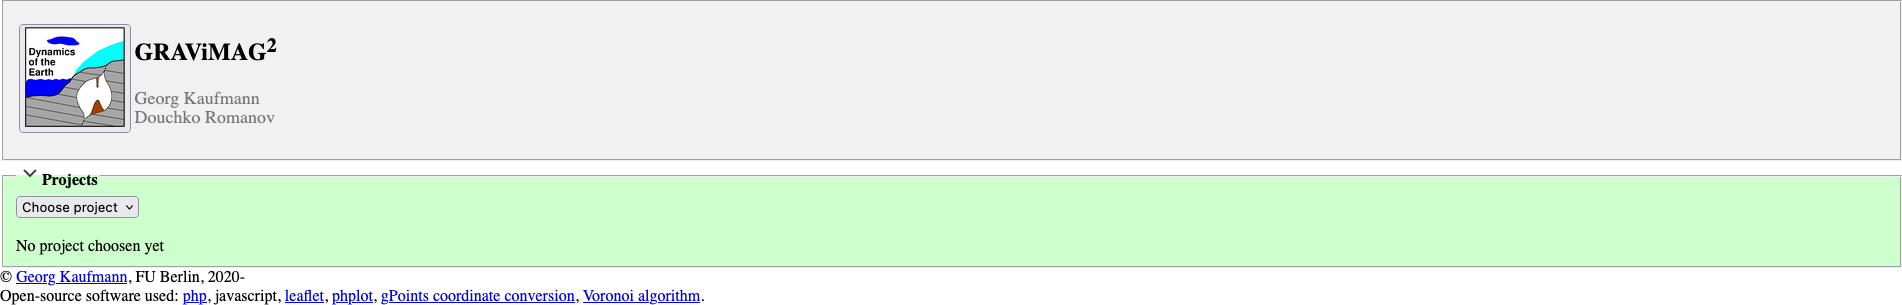
GRAViMAG start screen
From this start screen, you can access:
open old projects
create new projects
Create new project
we start creating a new project. Under Choose project, we use
new to create a new project. Fill in the form, search the location
in the map, and save the new project.
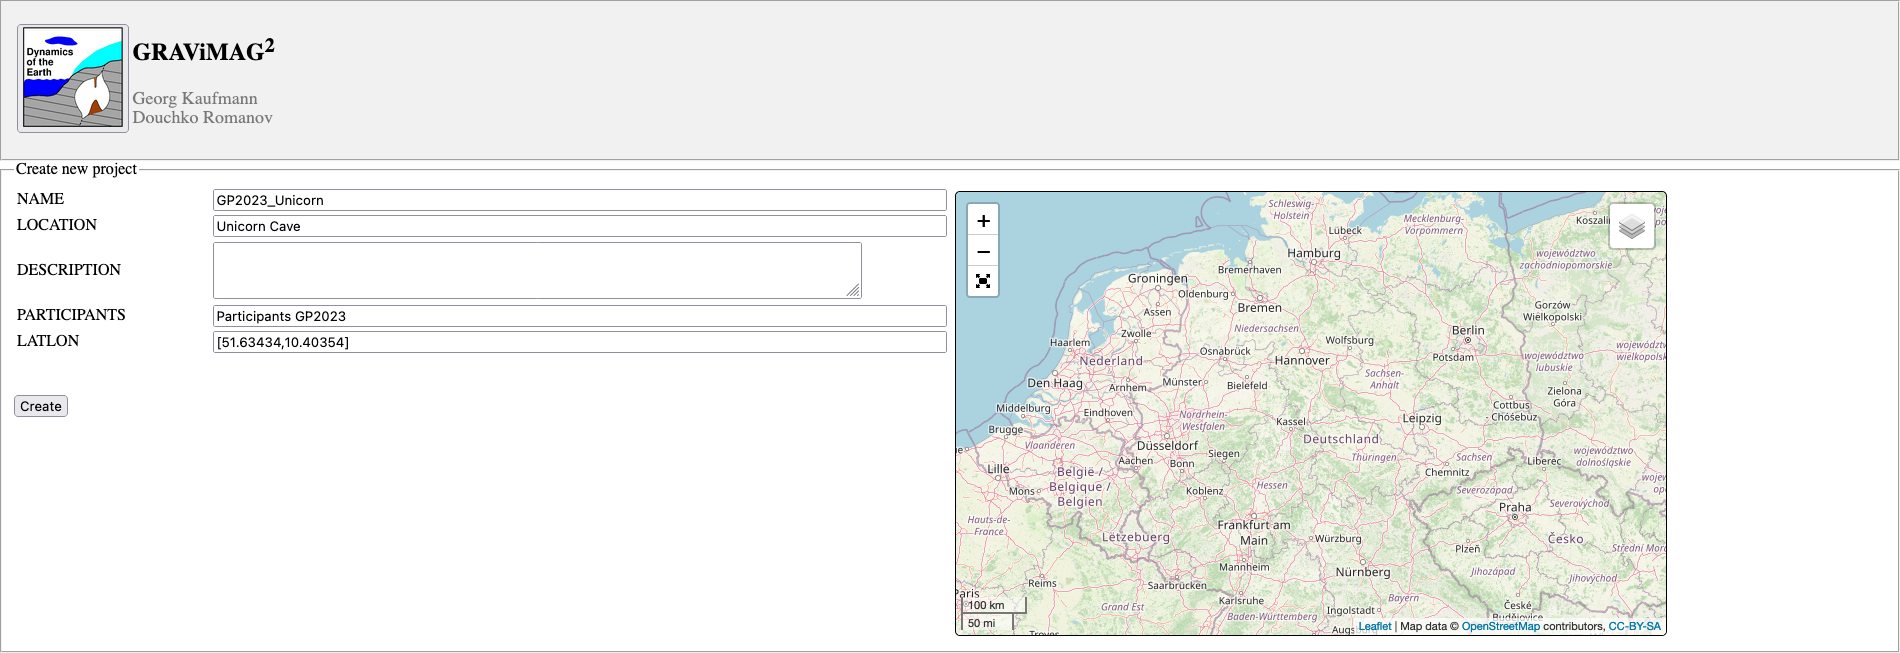
GRAViMAG New project
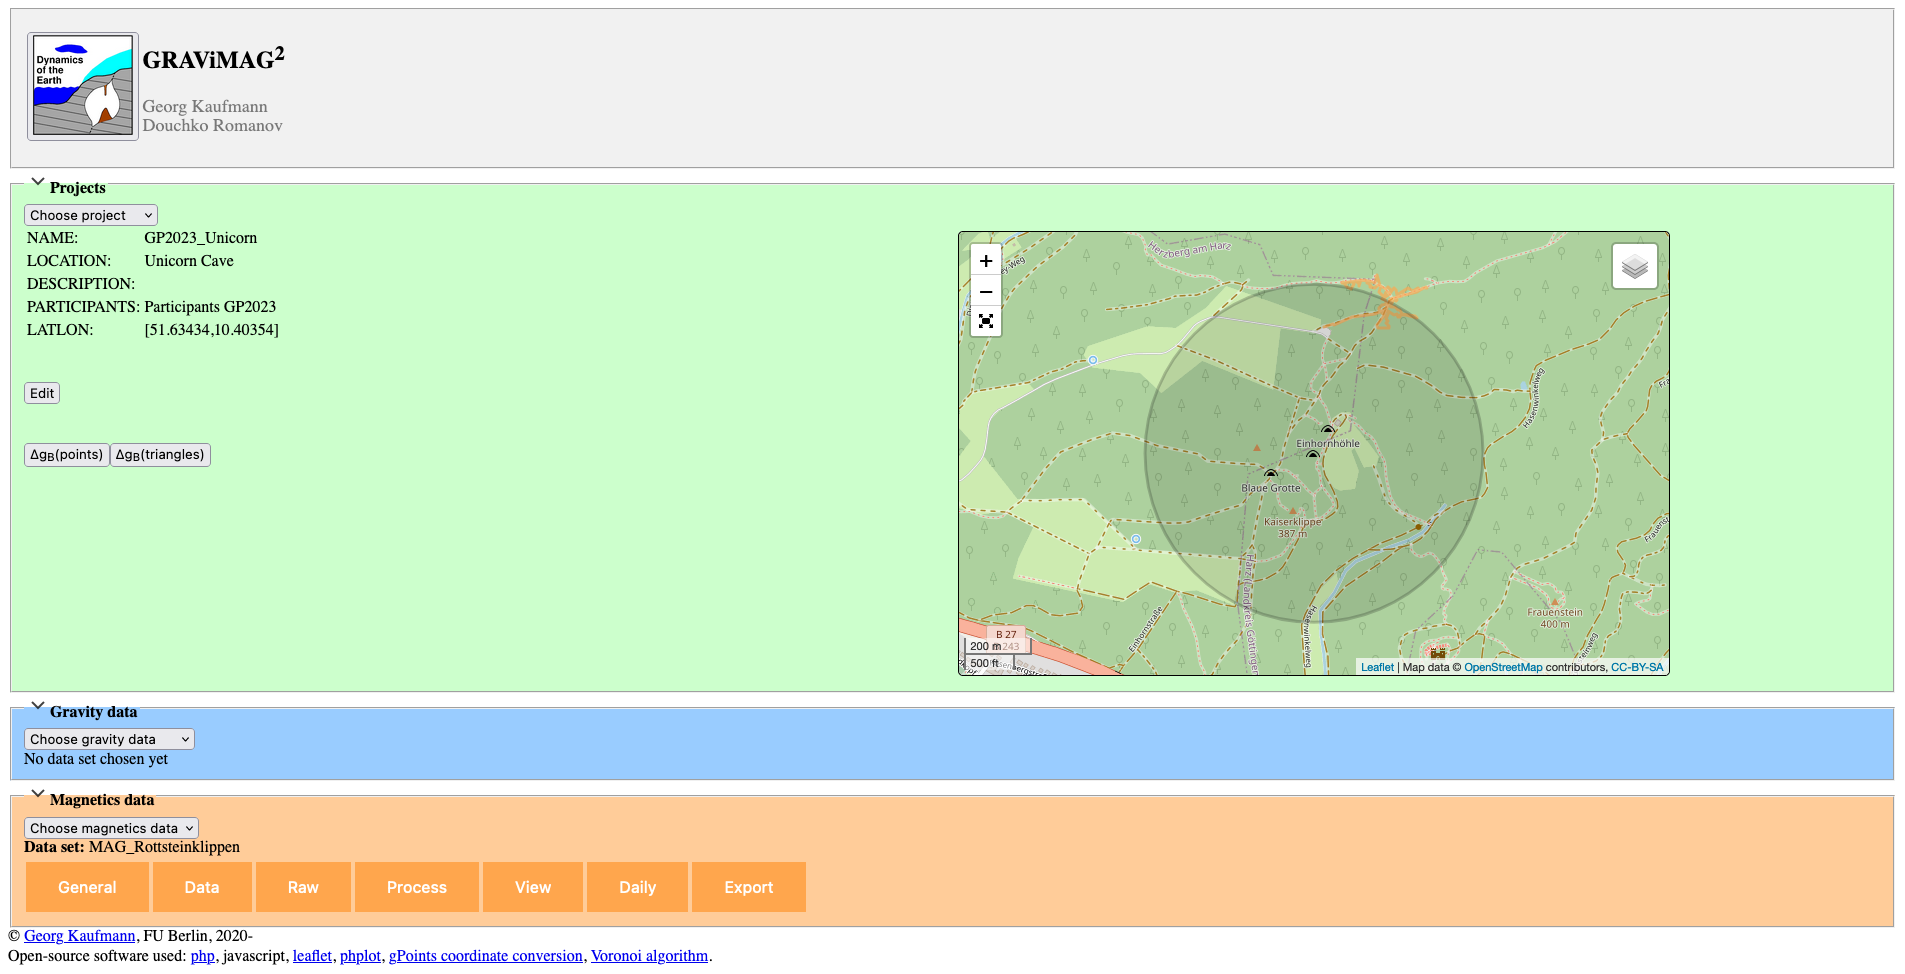
The newly created project is opened and the location displayed.
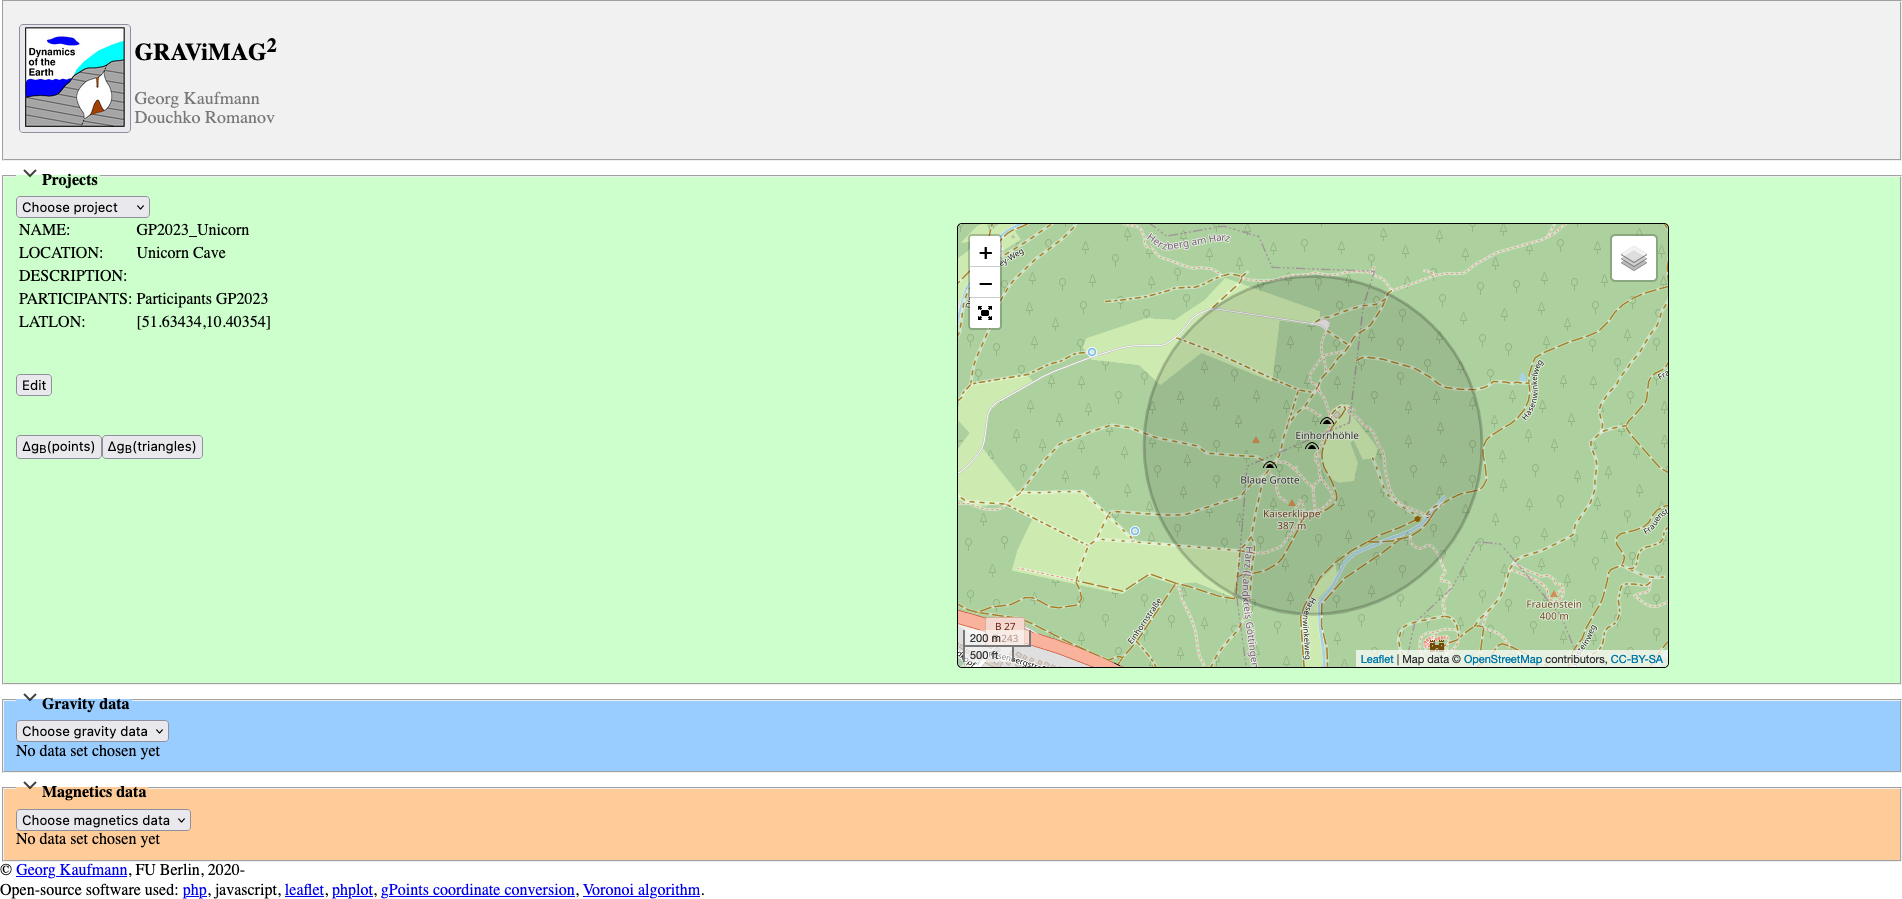
GRAViMAG Existing project
An existing project information can be edited later …
Once the project has been created, we start adding gravity and magnetic data sets.
Gravity data set
Under Gravity data, we choose new to create a new gravity data
set. We need to label the new data set, then it appears in the dropdown
list below. We load this newly created data set.
Note: If the data set has been processed, its data trace is shown in the map view window.
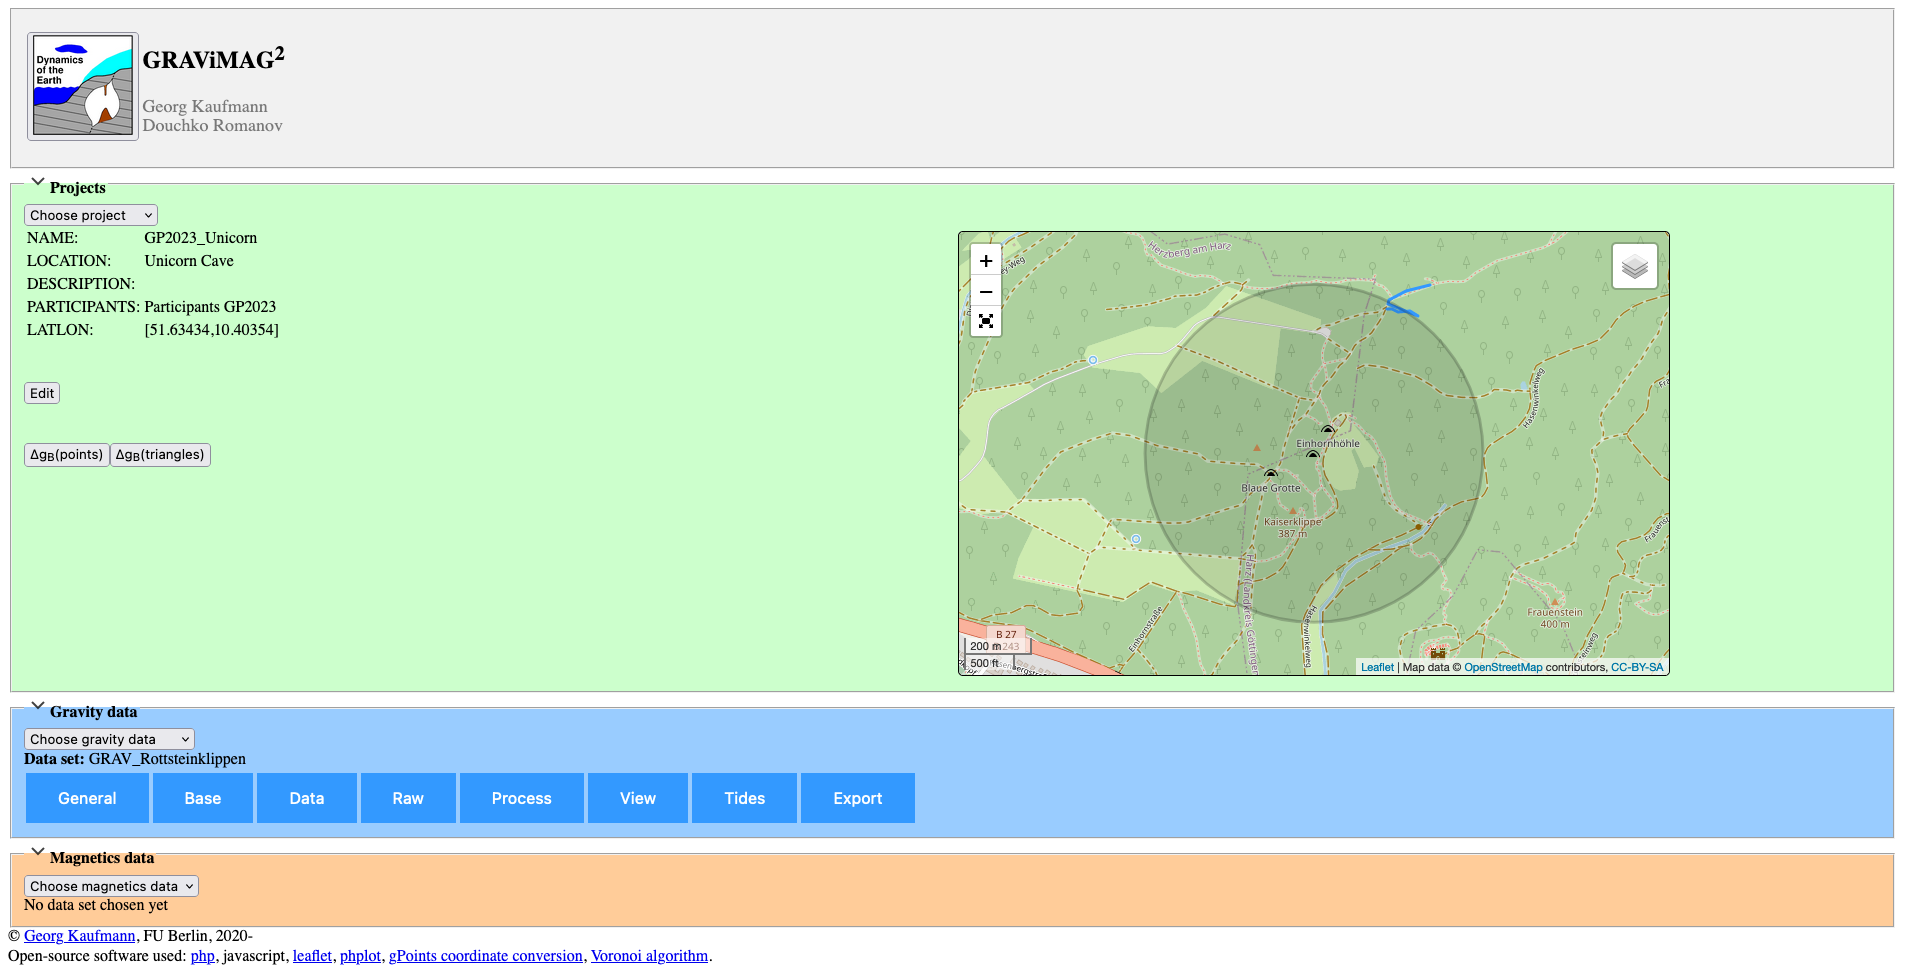
GRAViMAG Existing project
Below the label, several tabs have appeared, which we need to manage the data set:
General
Base
Data
Raw
Process
View
Tides
Export
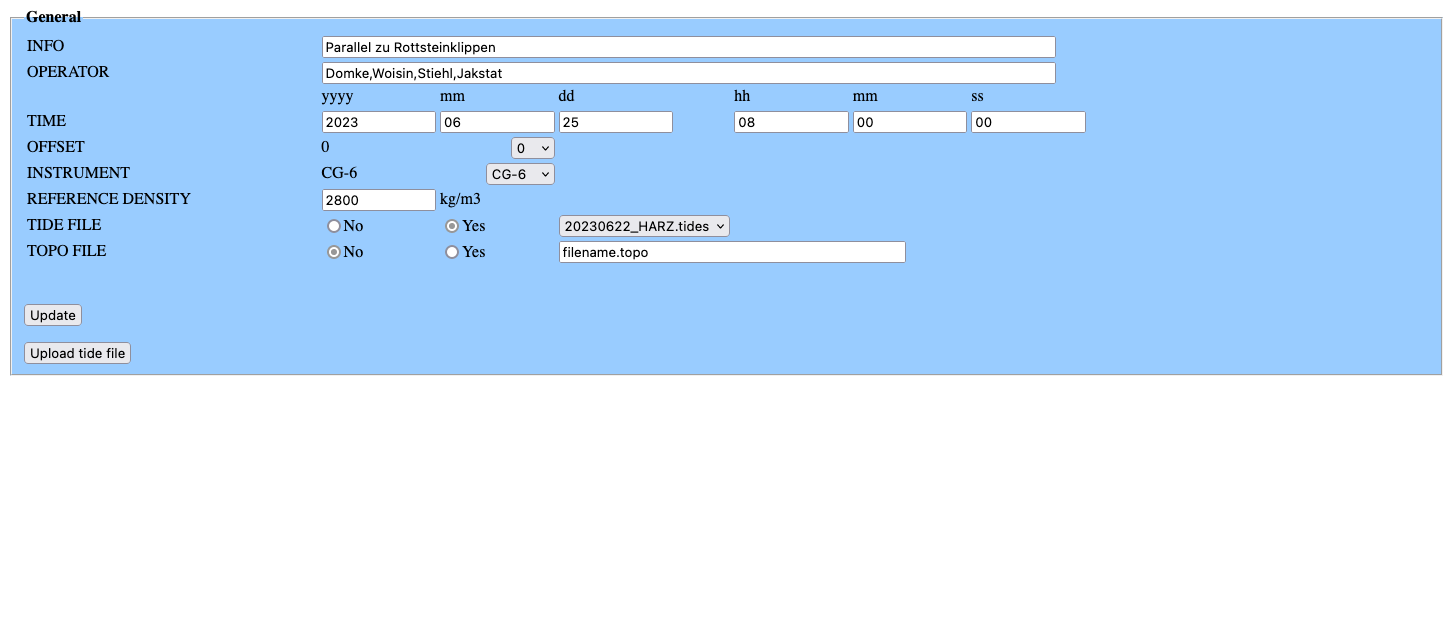
General
This tab holds general information about the data set. Besdies an info
string INFO, and the names of the operators OPERATOR, the start
time TIME of the data set is given, an offset time relate to GMT
time OFFSET, the instrument used INSTRUMENT, a reference density
RHO, and the use of an earht tide file TIDES.
The tide file needs to be uploaded first, and is the output of the
program eterna34…
GRAViMAG General tab
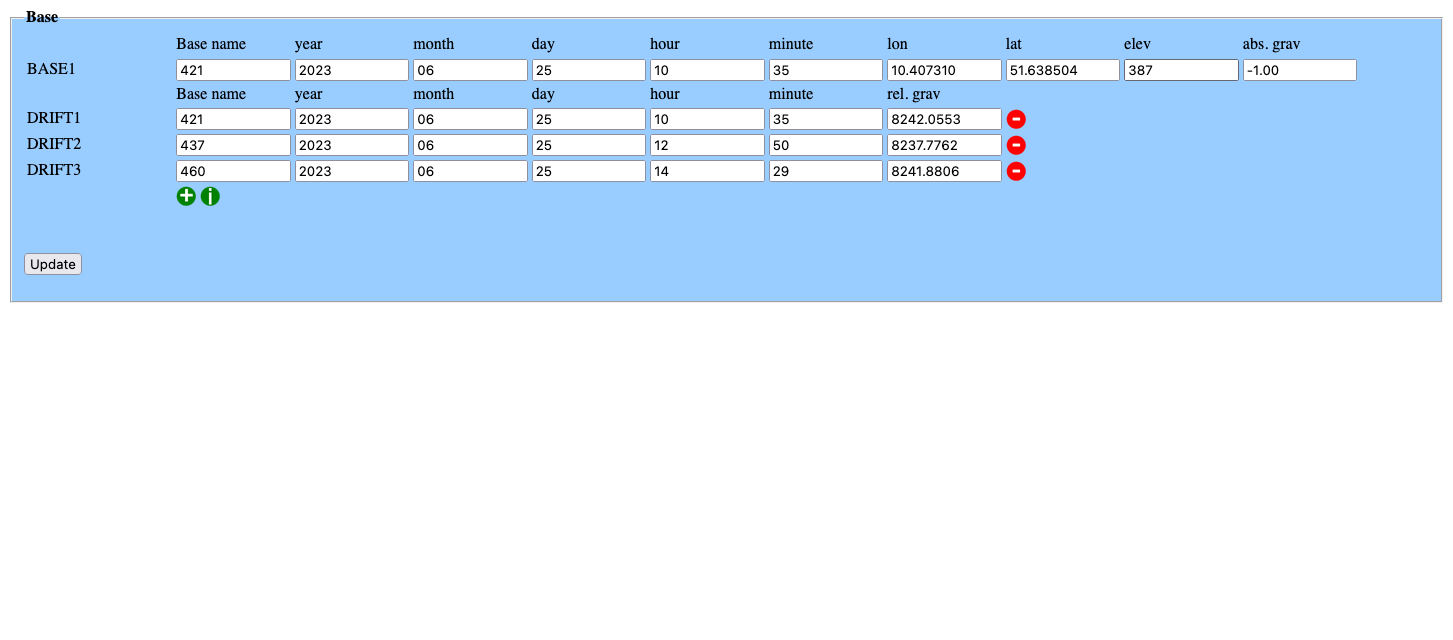
Base
This tab holds information about the base point.
Here, coordinates, and possibly a known absolute gravity value [mGal],
are stored BASE1. If no absolute gravity value is known, the value
-1 indicates that absolute gravity is calculated grom the geoid.
Then the repeted measurements of the base points are listed DRIFT1.
GRAViMAG Base tab
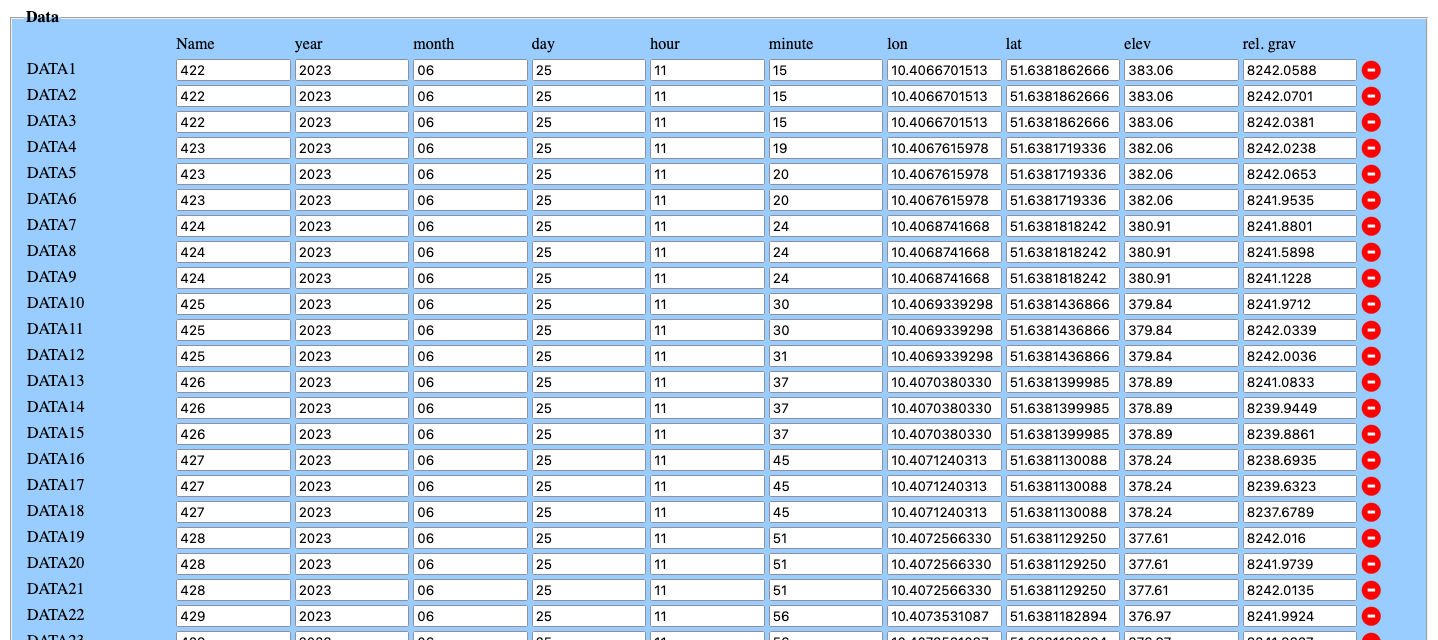
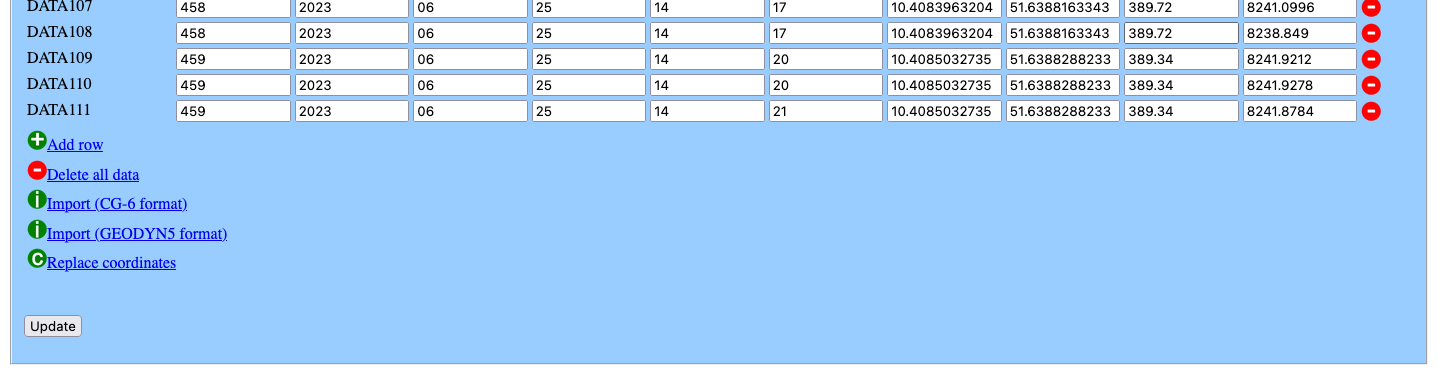
Data
This tab holds information about the data points.
Here, we can upload the file exported from the CG-6 gravimeter. To
accomplish this, we first iuse Delete all data to clear the table,
then use Import (CG-6 format) to import the gravity data.
If we have already processed the accurate coordinates and
elevations, we can swap them with the reading from the gravimeter,
using Replace coordinates.
GRAViMAG Data tab
GRAViMAG Data tab
Raw
This tab lists the information from the input tabs in an ascii format, usable for external processing…
Process
This tab is used to process the information entered. If the input tabs has been entered correctly, a log file will be shown …
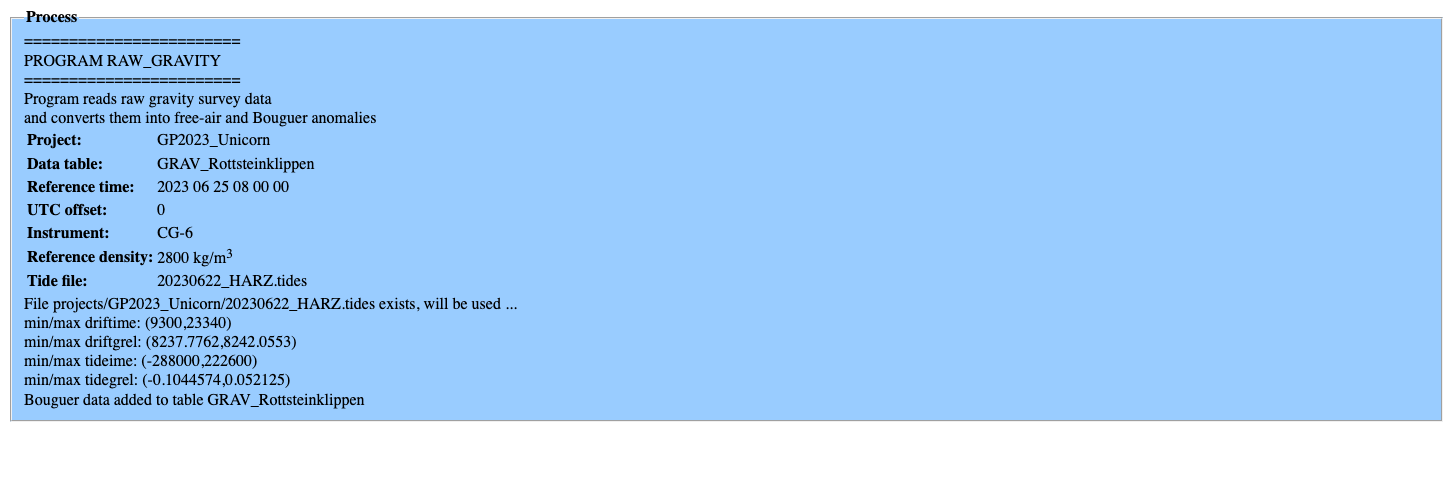
GRAViMAG Process tab
View
In this tab, the processed Bouguer anomaly can be visualised as a line plot.
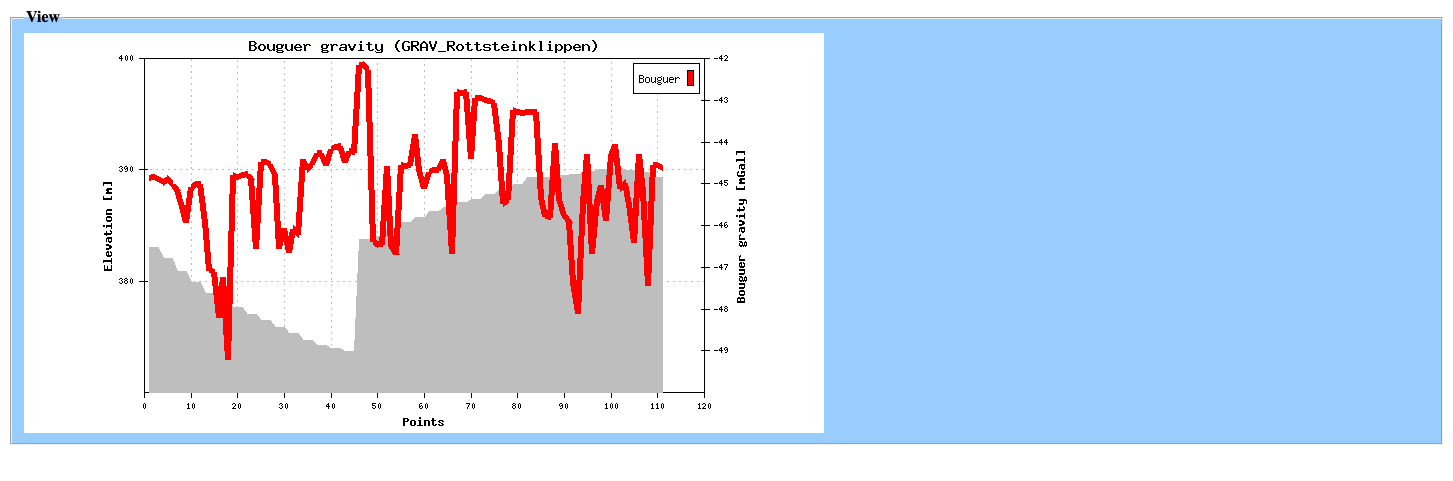
GRAViMAG View tab
Tides
In this tab, the loaded Earth tides can be visualised as a line plot.
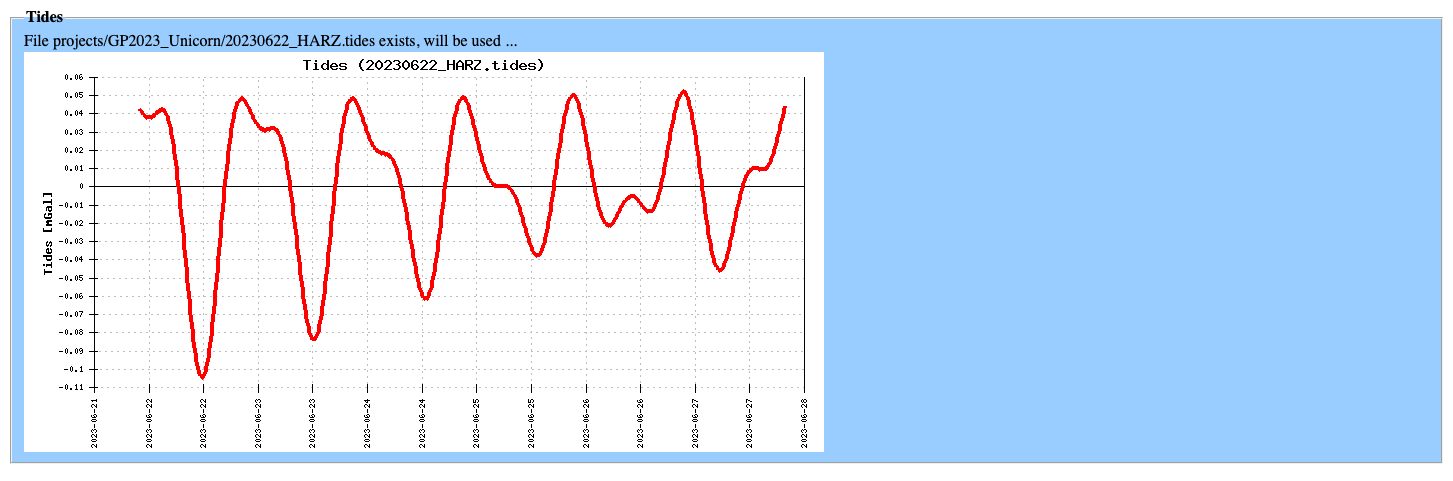
GRAViMAG Tides tab
Export
In this tab, the processed Bouguer gravity data can be exported into the geodyn format.

GRAViMAG Export tab
Magnetic data set
Under Magnetics data, we choose new to create a new magnetics
data set. We need to label the new data set, then it appears in the
dropdown list below. We load this newly created data set.
Note: If the data set has been processed, its data trace is shown in the map view window.
GRAViMAG Existing project
Below the label, several tabs have appeared, which we need to manage the data set:
General
Data
Raw
Process
View
Daily
Export
