Hallo
Methoden der empirischen Kommunikations- und Medienforschung
13. 10. 2025
Hallo

Arbeitsstelle Digitale Forschungsmethoden
Tell me why

giphy.com
Tell me why
Wissenschaftliche Lektürekompetenz: Wenn man aktuelle Forschung lesen möchte (oder muss), führt kein Weg an etwas komplexeren Analysen vorbei.
The thematic analysis of the disinformation narratives was structured by using the three-step coding framework of the grounded theory approach (e.g., Charmaz, 2006). Specifically, initial unstructured open coding was followed up by focused and axial coding to map variety on the themes resulting from the data.
Tell me why
Wissenschaftliche Lektürekompetenz: Wenn man aktuelle Forschung lesen möchte (oder muss), führt kein Weg an etwas komplexeren Analysen vorbei.
The meta-analyses were conducted in the R (version 4.3.1) statistical platform using the metaSEM package (Cheung, 2023). […] We used a random-effects model instead of a fixed-effects model as we did not assume that the included studies could represent the entire population of interest (Hunter & Schmidt, 2000).
Tell me why
Wissenschaftliche Lektürekompetenz: Wenn man aktuelle Forschung lesen möchte (oder muss), führt kein Weg an etwas komplexeren Analysen vorbei.
Multi-level logistic regression analysis was employed to test the hypotheses, because of the dependent variables’ dichotomous nature and nested structure of the data.
Tell me why
Wissenschaftliche Lektürekompetenz: Wenn man aktuelle Forschung lesen möchte (oder muss), führt kein Weg an etwas komplexeren Analysen vorbei.
The methods of textual analysis and grounded theory were used to explore social practices, representations, assumptions, and stories. The process was cyclical and interactive between researcher and data (Corbin, 2016), from an initial stage during which texts were read for familiarity, to deeper levels of analysis of linguistic and grammatical structures […], to the emergence and consolidation of common stories and themes.
Tell me why
Wissenschaftliche Lektürekompetenz: Wenn man aktuelle Forschung lesen möchte (oder muss), führt kein Weg an etwas komplexeren Analysen vorbei.
Due to overdispersion in retweet counts, we used negative binomial regression with weekly aggregated data to test if discourse types, network structures, and dynamics predicted issue-related retweets (H1 and H2).
Tell me why
(Einstieg in die) Anwendungskompetenz: Wer Analysen praktisch nachvollzogen hat, kann in Seminar- und Abschlussarbeiten darauf aufbauen.
Tell me why
Alltagswissen: Fähigkeiten für gesellschaftliches Leben und den Arbeitsmarkt
- Konsument:innen und Produzent:innen empirischer Evidenzen
- Mis-/Dis-/False Information
- AI: Modern-Day Oracles or Bullshit Machines? How to thrive in a ChatGPT world
- …
Tell me why
Warum überhaupt eine Programmiersprache?
- Code literacy als wissenschaftliche Kompetenz und Alltagsompetenz in moderner Gesellschaft
Warum R?
- Eine der beiden großen Sprachen für Arbeit mit Daten (neben Python)
- Freie Software: Free as in freedom
- Relativ einfach zu lesen, vielfältig einsetzbar (z.B. alle Kursmaterialien inklusive dieser Folien und der Website)

Tell me why
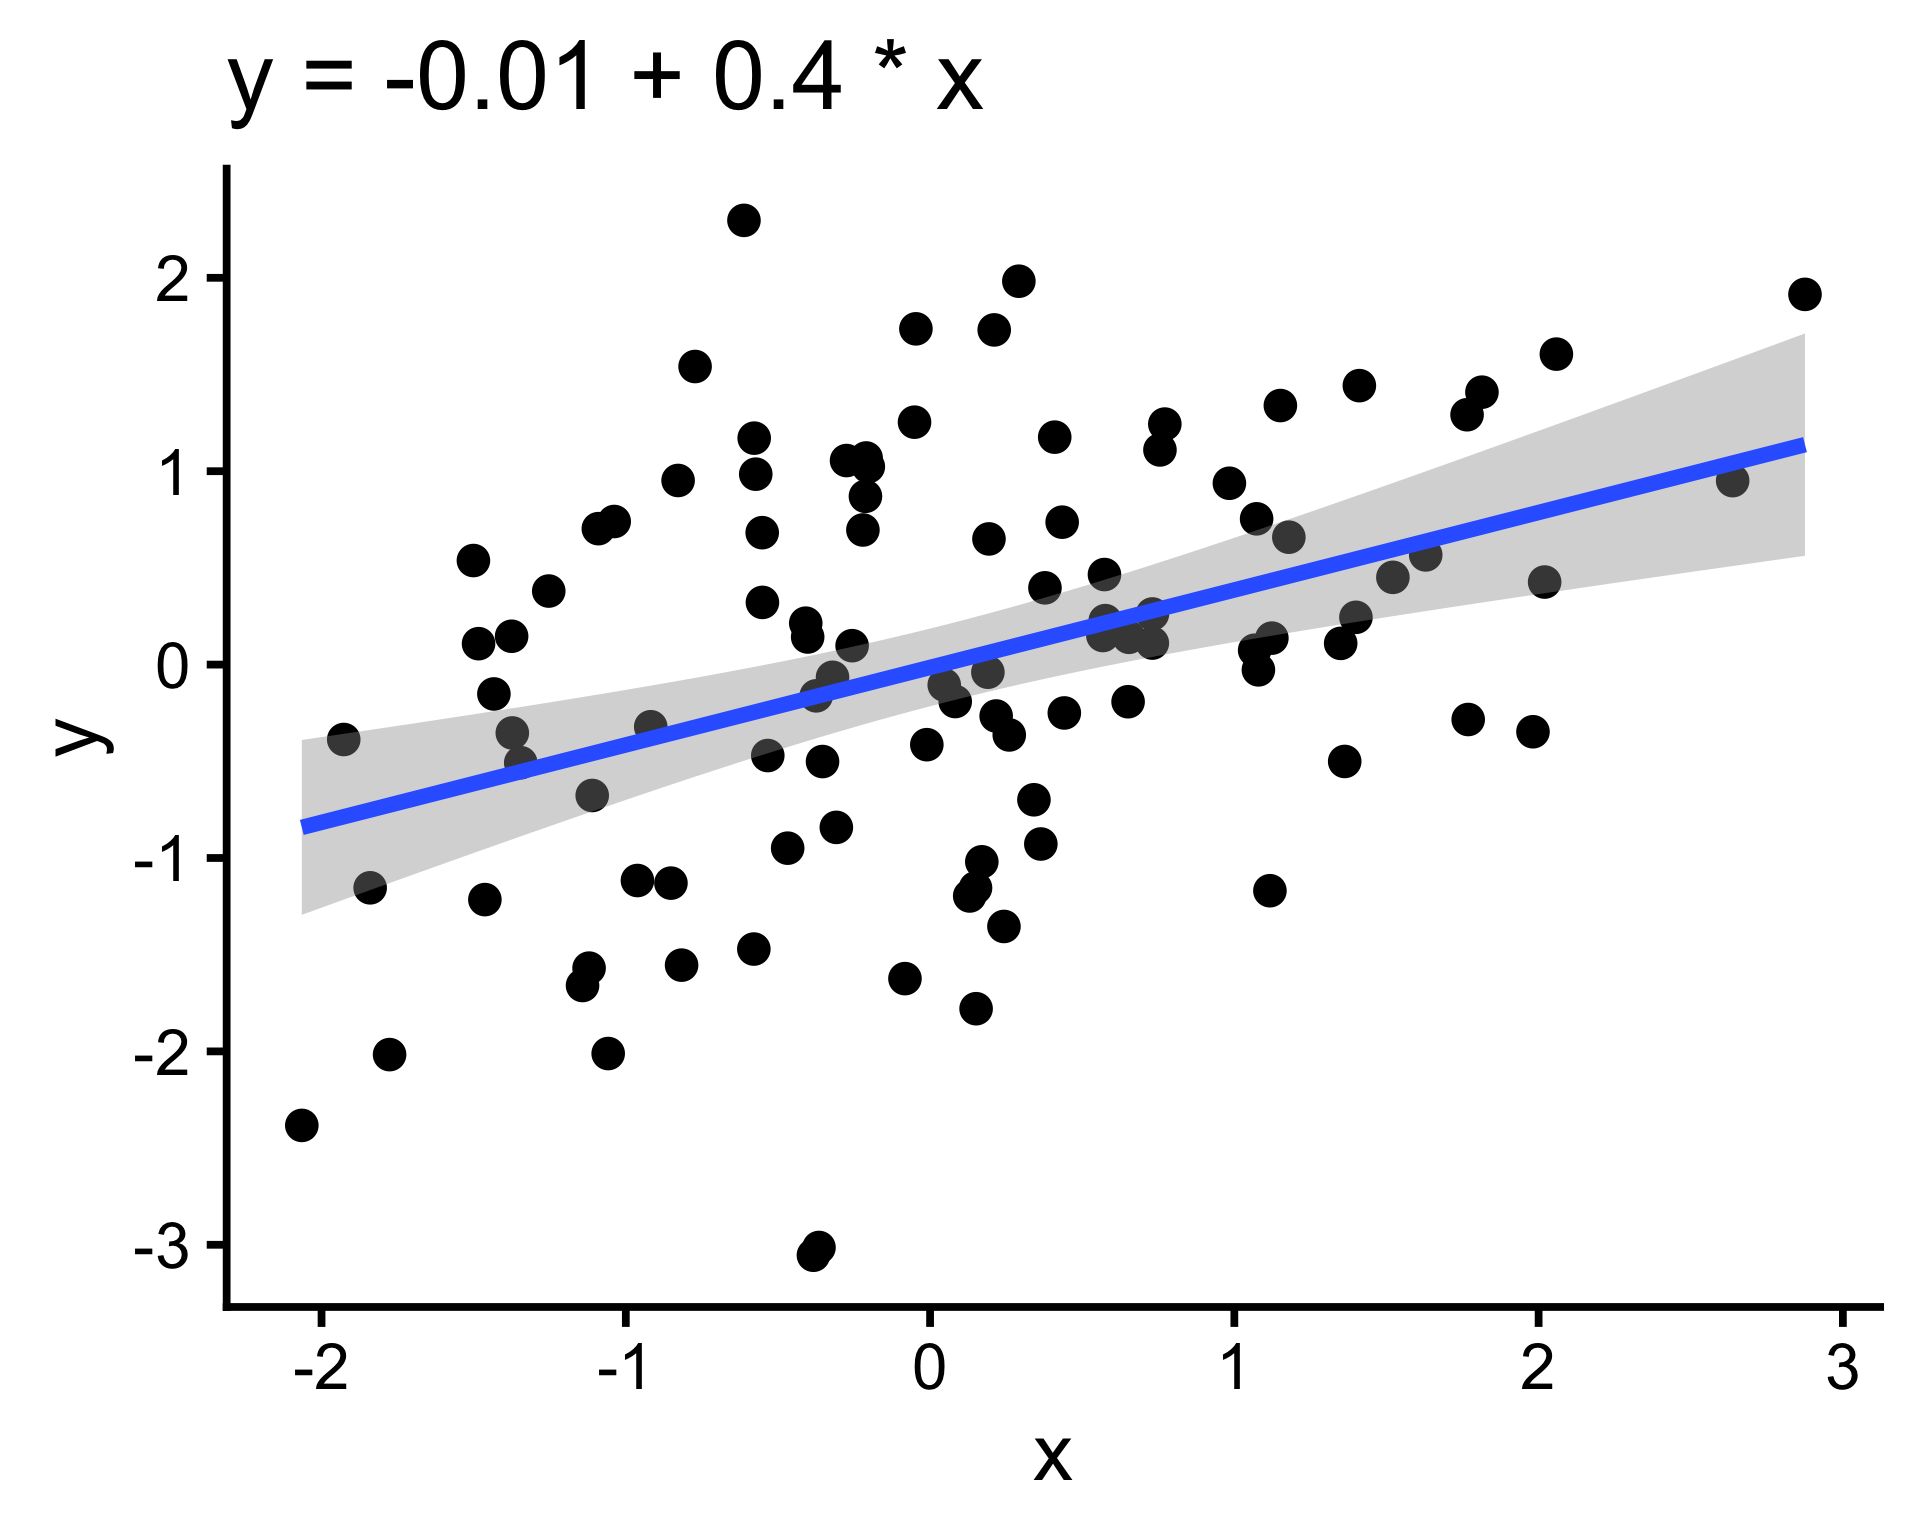
Was haben die Backstreet Boys und Lineare Regression gemeinsam?
Vorkenntnisse

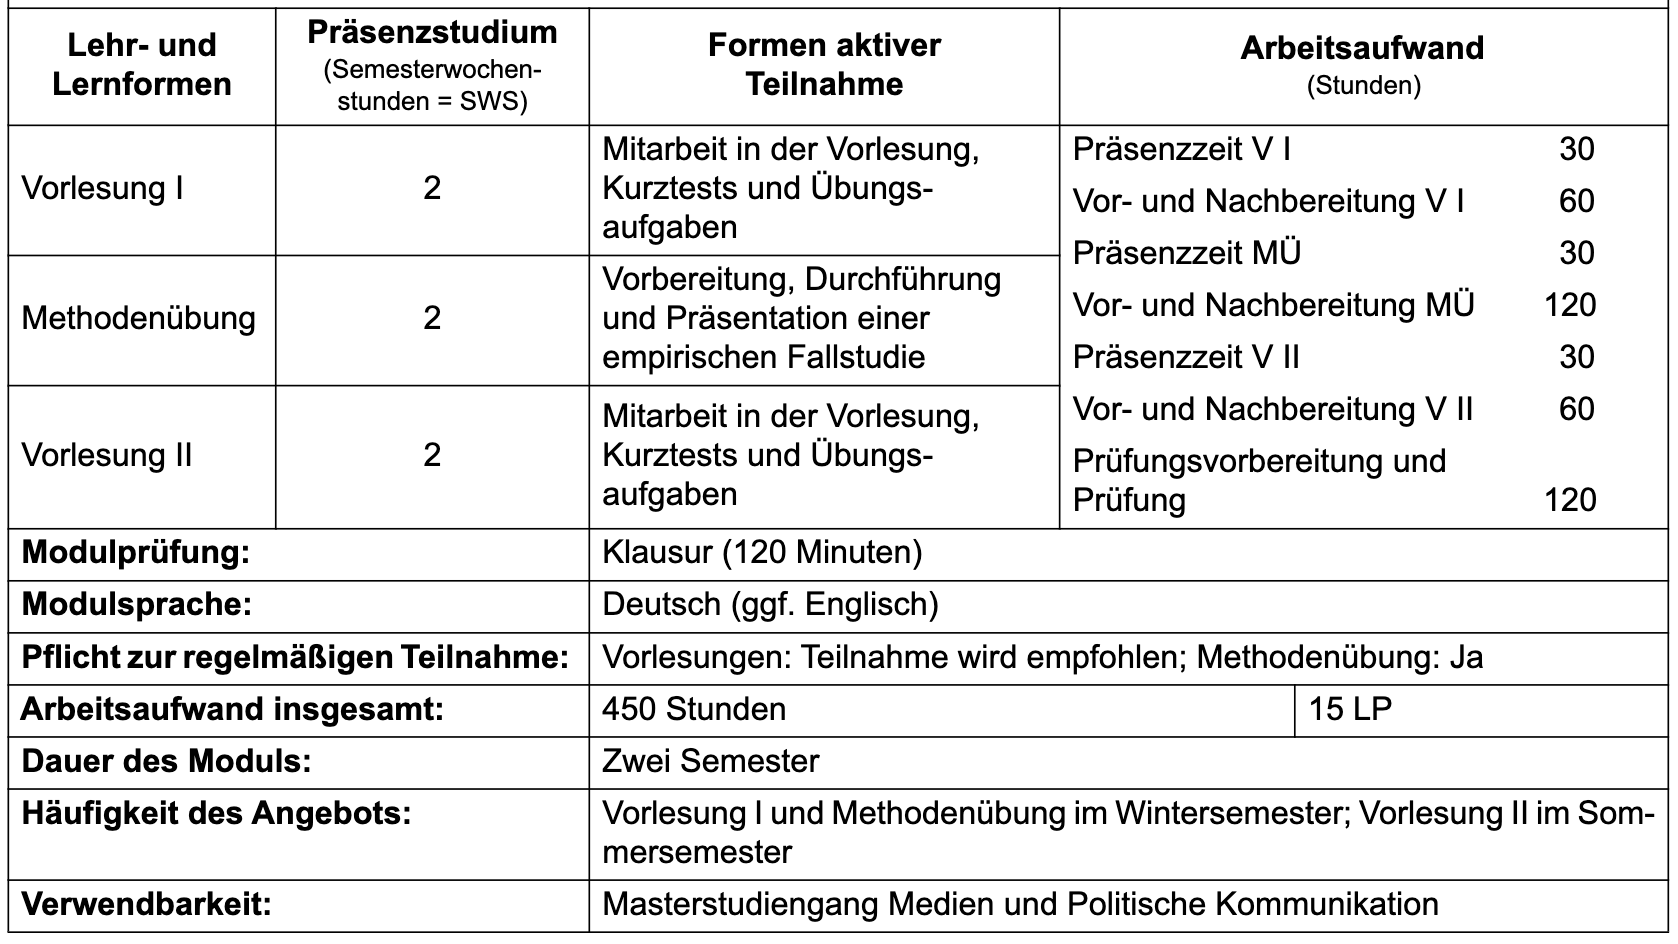
Aufbau des Moduls in der SPO
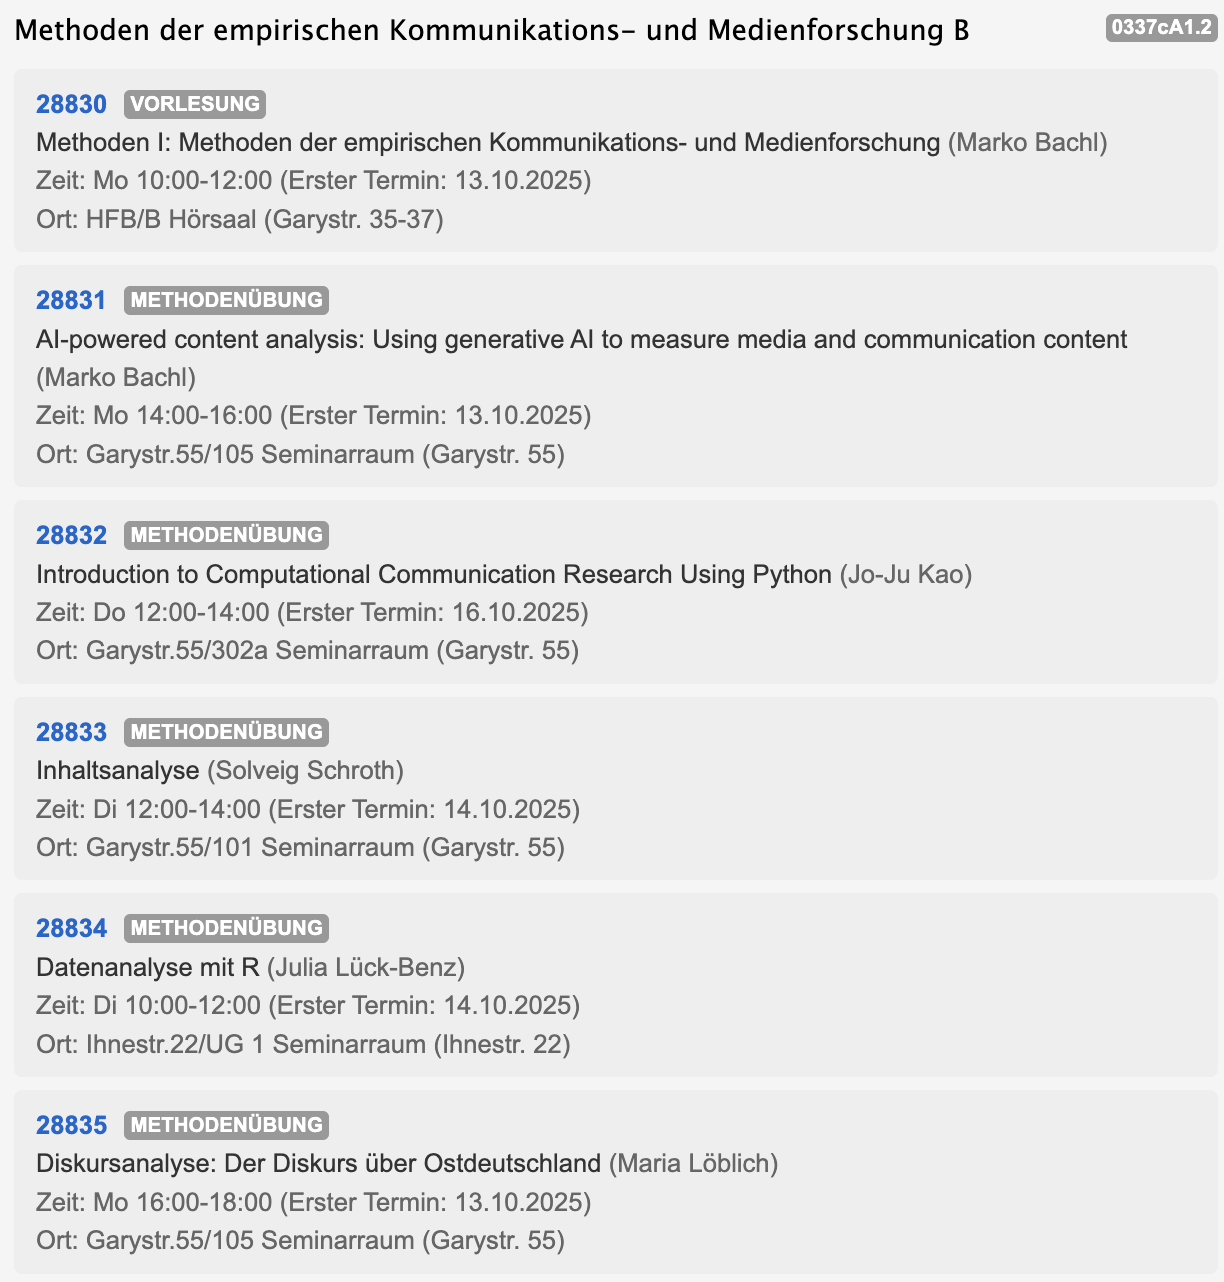
Modul im Vorlesungsverzeichnis
Syllabus

Abtippen: https://userpage.fu-berlin.de/bachlm83/mame_public/
Link in Blackboard
Vorlesungsplan
Vorlesungsplan im Syllabus; Comic: https://phdcomics.com/comics.php?f=1583
Rahmenbedingungen
Rahmenbedingungen im Syllabus; Comic: https://phdcomics.com/comics.php?f=1583