In the upcoming chapters we will work with remotely sensed imagery. We will mostly process Landsat 8 imagery of the Berlin region downloaded from the U.S. Geological Survey (USGS) EarthExplorer on October, 14 2022. First, you will be given a short introduction into Landsat 8 data products.
About Landsat
Landsat is a joint project of the U.S. Geological Survey and the NASA. The Landsat Earth Observation satellites have continuously acquired images of the Earth's land surface, providing uninterrupted data about natural resources and the environment (USGS 2022). Landsat 8 was launched on February 11, 2013 and comes with a repeat coverage of 16 days (NASA).
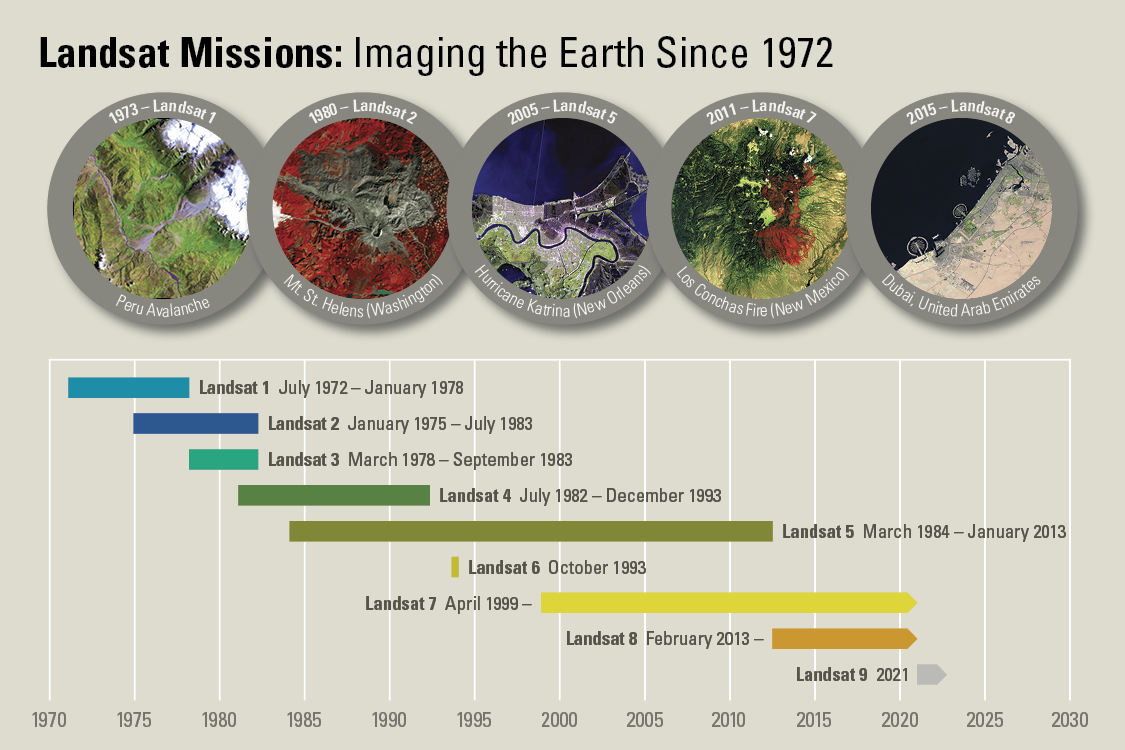
 Timeline of Landsat Missions, Source: USGS 2016.
Landsat 8 Instruments
Landsat 8 carries two sensors. The Operational Land Imager (OLI) and the Thermal Infrared Sensor (TIRS). Landsat OLI includes the follwoing nine spectral bands (USGS 2018):
| Band | Property | Wavelength range (µm) | Spatial Resolution (m) |
|---|---|---|---|
| 1 | Coastal Aerosol | 0.43 - 0.45 | 30 |
| 2 | Blue (VIS) | 0.450 - 0.51 | 30 |
| 3 | Green (VIS) | 0.53 - 0.59 | 30 |
| 4 | Red (VIS) | 0.64 - 0.67 | 30 |
| 5 | Near-Infrared (nIR) | 0.85 - 0.88 | 30 |
| 6 | SWIR 1 | 1.57 - 1.65 | 30 |
| 7 | SWIR 2 | 2.11 - 2.29 | 30 |
| 8 | Panchromatic (PAN) | 0.50 - 0.68 | 15 |
| 9 | Cirrus | 1.36 - 1.38 | 30 |
Landsat TIRS comes with t wo spectral bands (USGS 2018):
| Band | Property | Wavelength range (µm) | Spatial Resolution (m) |
|---|---|---|---|
| 10 | TIRS 1 | 10.6 - 11.19 | 100 |
| 11 | TIRS 2 | 11.5 - 12.51 | 100 |
