In addition to inferential methods for hypothesis tests for population parameters, such as the mean, $\mu$, and the standard deviation, $\sigma$, there are statistical methods to make inferences about the distribution of a variable. These inferential procedures rely on the chi-square ($\chi^2$) distribution and thus are called $\chi^{2}$-tests.
In the following section, we discuss the chi-square goodness-of-fit test, a hypothesis test that is applied to make inferences about the distribution of a variable. Then we will look at the chi-square independence test, a hypothesis test that is applied to decide whether an association exists between two variables of a population. The biggest advantage of chi-square statistics is that we do not need any parameters to compare frequency distributions. Thus, in case of doubt about the underlying metric of our variables, chi-square statistics provide a non-metric alternative to moment-based tests.
$\chi^{2}$-Distribution
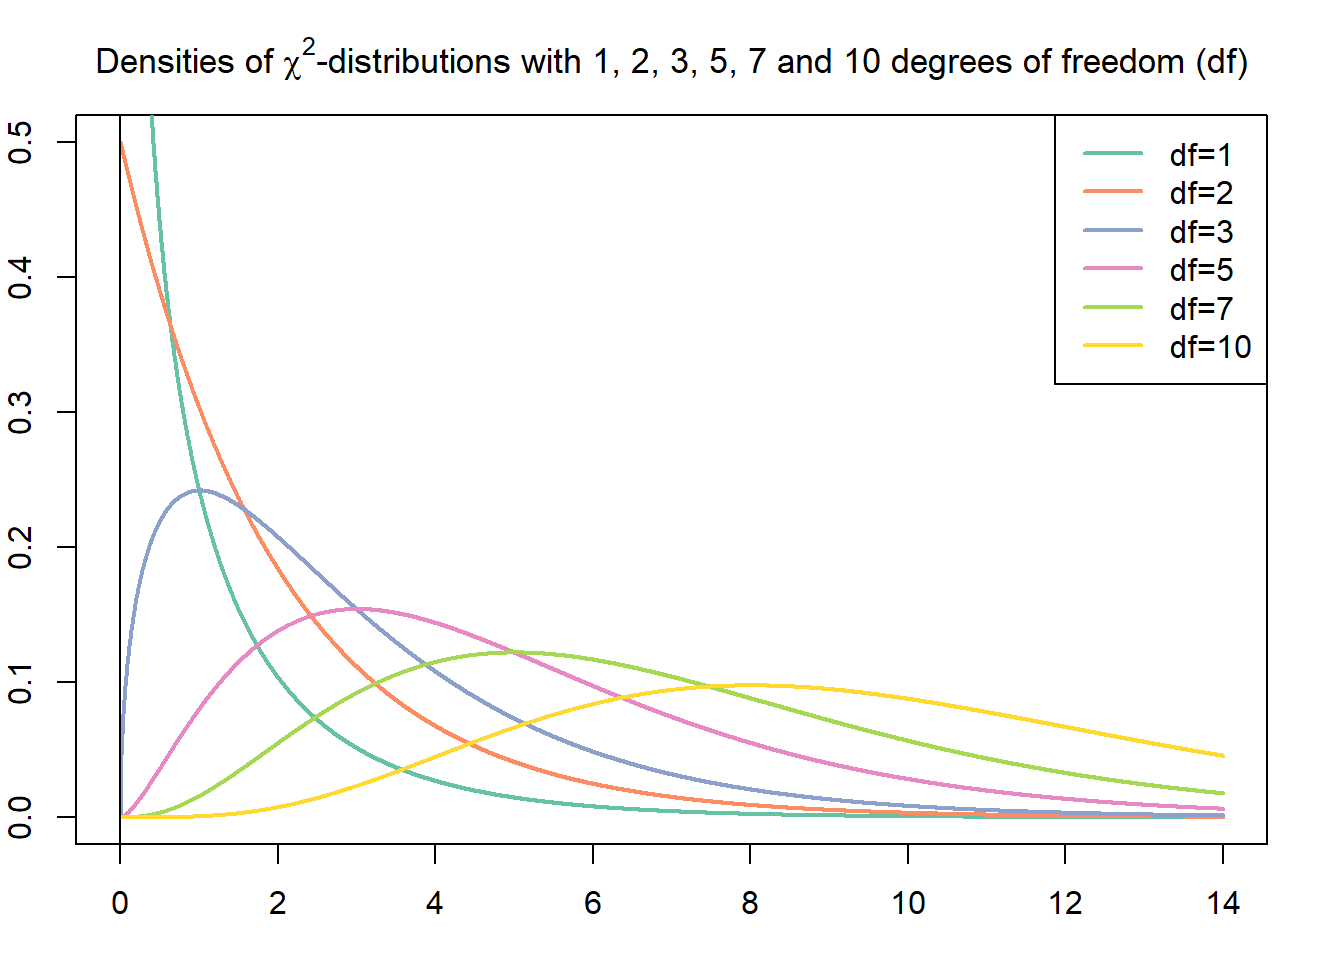
Basic Properties of $\chi^{2}$-Curves (Weiss, 2010)
- The total area under a $\chi^{2}$-curve equals 1.
- A $\chi^{2}$-curve starts at 0 on the horizontal axis and extends indefinitely to the right, approaching, but never touching, the horizontal axis as it does so.
- A $\chi^{2}$-curve is right skewed.
- As the number of degrees of freedom becomes larger, $\chi^{2}$- curves look increasingly like normal curves.