Multiple lineare Regression
Methoden der empirischen Kommunikations- und Medienforschung
Marko Bachl
Freie Universität Berlin
Fragen zur Übung?
Agenda
- Grundlagen der multiplen Regression
- Kategorielle Prädiktoren
- “Große” Regressionsmodelle
- Annahmen und ihre Überprüfung
- Übungen
Daten der heutigen Sitzung

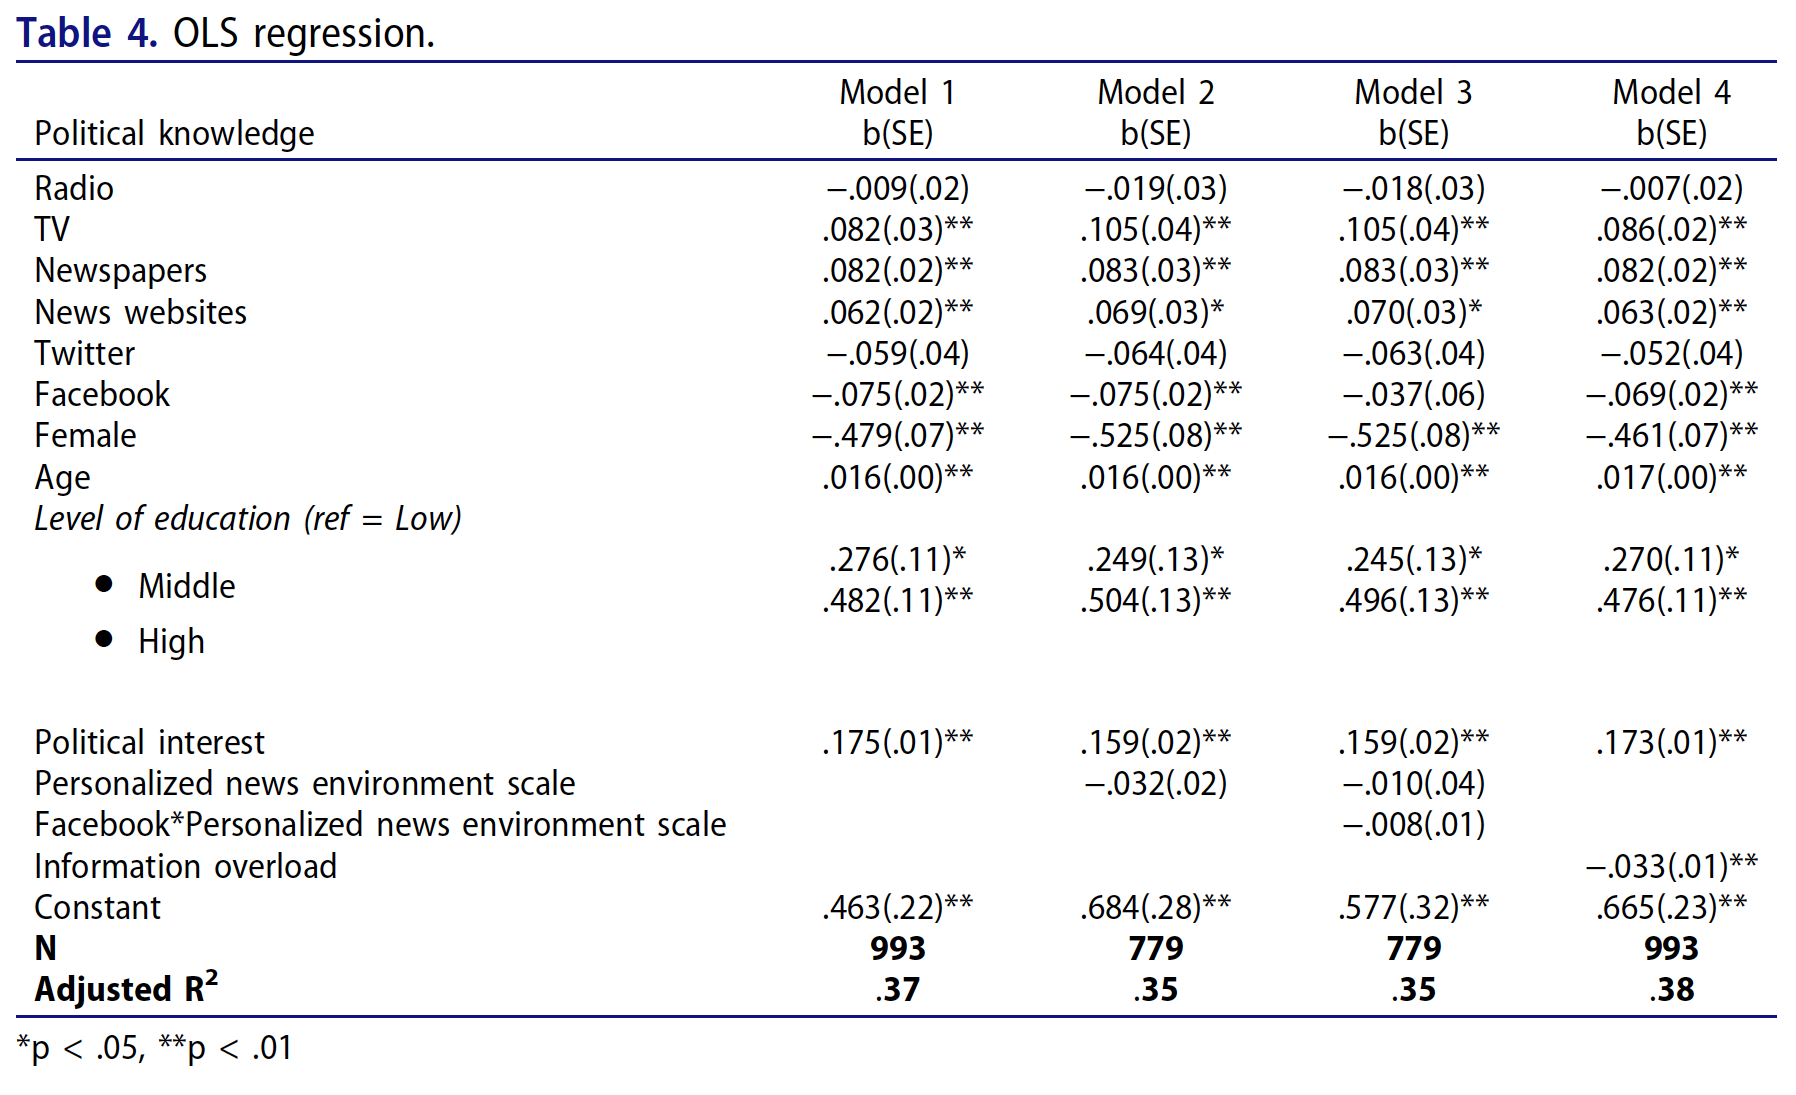
Modelle der heutigen Sitzung (hier: M1 & M4)
Grundlagen der multiplen Regression
Grundgedanke der multiplen Regression
Die Berücksichtigung mehrerer Prädiktoren in einer Analyse ermöglicht
- Eine Verbesserung der Erklärungsleistung des gesamten Modells
- Eine Verbesserung der Vorhersagequalität des gesamten Modells
- Den Vergleich der Bedeutung von Zusammenhängen
- Die Berücksichtigung von Drittvariablen bei Vergleichen
- Mit zusätzlichen Annahmen: Schätzen von kausalen Effekten mit nicht-experimentellen Daten
- In komplexeren Modellen: Modellierung von Wechselwirkungen mehrerer Einflüsse (Moderation)
- In komplexeren Modellvergleichen: Modellierung von mehrstufigen Zusammenhängen (X → M → Y, Mediation)
Grundgedanke der multiplen Regression
- Schätzung der aV durch die Linearkombination mehrerer uV
- Die Regressionskoeffizienten werden nach der Methode der kleinsten Quadrate (OLS) so geschätzt, dass die Quadratsumme der Residuen minimiert wird: \(\beta = (X^TX)^{-1}X^TY\)
- Im einfachen, linearen Fall wird ein additives Modell angenommen, d.h., wir gehen davon aus, dass sich die Einflüsse der Prädiktoren auf die aV aufsummieren
- Die Koeffizienten \(b_i\) werden als partielle Regressionskoeffizienten bezeichnet.
- Regressionsgerade: \(\text{Political Knowledge} = b_0 + b_1 \times \text{Radio} + b_2 \times \text{TV} + b_3 \times \text{Newspapers} + b_4 \times \text{Age} + \ldots + \varepsilon\)
Regressionstabelle
| Parameter | Coefficient | 95% CI | t(990) | p | Std. Coef. | Std. Coef. 95% CI | Fit |
|---|---|---|---|---|---|---|---|
| (Intercept) | 0.99 | (0.67, 1.31) | 6.07 | < .001 | 0.00 | (-0.06, 0.06) | |
| Age | 0.02 | (0.02, 0.03) | 8.24 | < .001 | 0.24 | (0.19, 0.30) | |
| Newspapers | 0.22 | (0.18, 0.27) | 9.31 | < .001 | 0.28 | (0.22, 0.33) | |
| R2 (adj.) | 0.16 |
Text auf der nächsten Folie
Regressionstabelle - Orientierungshilfe
- Parameter: Name des Prädiktors; (Intercept) = Konstante = Schnittpunkt mit y-Achse wenn alle Prädiktoren = 0
- Coefficient: Partielle Regressionskoeffizienten in Einheiten der Variablen (hier: Jahre, Skalenpunkte, Zahl richtige Antworten)
- 95% CI: 95% Konfidenzintervalle um Coefficient; Werte in diesem Intervall können wir plausibel mit den Daten vereinbaren
- t(990): \(t\)-Werte = \(\text{Coefficient} / \text{SE}_\text{Coefficient}\); Freiheitsgrade in Klammern; Daraus ergibt sich der p-Wert.
- p: \(p\)-Wert; Wie wahrscheinlich wäre es, diesen oder einen noch größeren Regressionskoeffizienten zu ermitteln, wenn der Regressionskoeffizient in der Grundgesamtheit = 0 wäre? Wenn \(p < \alpha\), dann nennen wir den Koeffizienten “statistisch signifikant”.
- Std. Coef., Std. Coef. 95% CI:
- Standardisierter partieller Regressionskoeffizienten mit ihren 95% Konfidenzintervallen.
- Alle quasi-metrischen Prädiktoren und die abhängige Variable werden vor der Schätzung Z-standardisiert (Mittelwert = 0, SD = 1).
- Vorsicht: Manchmal werden auch standardisierte Koeffizienten für binäre Prädiktoren berichtet; schwer zu interpretieren, da binäre Prädiktoren keine SD haben.
- Liegt (fast) immer im Bereich \([-1; +1]\); ähnlich (nicht identisch!) Korrelationskoeffizient r
- Zusammenhänge in Einheiten von Standardabweichungen sind zwischen Prädiktoren, die mit unterschiedlichen Einheiten gemessen wurden, vergleichbar.
- Fit, R2 (adj.): Anteil erklärter Varianz durch das gesamte Modell (alle Prädiktoren gemeinsam), angepasst um die zufällige Erklärung durch jeden weiteren Prädiktor. Details in 4 Folien.
Interpretation: Vergleich
| Parameter | Coefficient | 95% CI | t(990) | p | Std. Coef. | Std. Coef. 95% CI | Fit |
|---|---|---|---|---|---|---|---|
| (Intercept) | 0.99 | (0.67, 1.31) | 6.07 | < .001 | 0.00 | (-0.06, 0.06) | |
| Age | 0.02 | (0.02, 0.03) | 8.24 | < .001 | 0.24 | (0.19, 0.30) | |
| Newspapers | 0.22 | (0.18, 0.27) | 9.31 | < .001 | 0.28 | (0.22, 0.33) | |
| R2 (adj.) | 0.16 |
- Zwei Personen, die in allen \(x_k\) dieselbe Ausprägung haben und sich in \(x_1\) um einen Skalenpunkt unterscheiden, unterscheiden sich in \(y\) um \(b_1\) Punkte.
- Wir vergleichen zwei Personen, die sich im Alter um ein Jahr unterscheiden und die gleich häufig Zeitungen nutzen. Die ältere Person beantwortet 0.02 Fragen mehr korrekt als die jüngere Person.
- Wir vergleichen zwei gleich alte Personen, deren Zeitungsnutzung sich um einen Skalenpunkt unterscheidet. Die Person, die sich häufiger über Zeitungen informiert, beantwortet 0.22 Fragen mehr korrekt.
- Entsprechende Interpretation mit standardisierten partiellen Regressionskoeffizienten: Standardabweichungen statt Punkte / Jahre / Fragen
Interpretation: Veränderung, Intervention
| Parameter | Coefficient | 95% CI | t(990) | p | Std. Coef. | Std. Coef. 95% CI | Fit |
|---|---|---|---|---|---|---|---|
| (Intercept) | 0.99 | (0.67, 1.31) | 6.07 | < .001 | 0.00 | (-0.06, 0.06) | |
| Age | 0.02 | (0.02, 0.03) | 8.24 | < .001 | 0.24 | (0.19, 0.30) | |
| Newspapers | 0.22 | (0.18, 0.27) | 9.31 | < .001 | 0.28 | (0.22, 0.33) | |
| R2 (adj.) | 0.16 |
- Wenn \(x_1\) um einen Punkt steigt und alle anderen \(x_k\) konstant gehalten werden, steigt \(y\) um \(b_1\) Punkte.
- Wenn eine Person um ein Jahr älter wird und ihr Zeitungsnutzungsverhalten nicht verändert, beantwortet sie 0.02 Fragen mehr korrekt (Annahme: Kontrolle von Zeitungsnutzung deckt alle alternativen Ursachen von politischem Wissen ab).
- Wenn eine Person ihre Zeitungsnutzung um einen Skalenpunkt steigert, dann beantwortet sie unmittelbar (im Sinne von: nichts durch weiteres Lebensalter gelernt) 0.22 Fragen mehr korrekt (Annahme: Kontrolle von Alter deckt alle alternativen Ursachen von politischem Wissen ab).
- Entsprechende Interpretation mit standardisierten partiellen Regressionskoeffizienten: Standardabweichungen statt Punkte / Jahre / Fragen
Lineare Regression: \(R^2\)
Beispiel für vier Befragte:
| Age | y | yhat | e | e2 | e_M | e_M2 |
|---|---|---|---|---|---|---|
| 23 | 1 | 2.2 | -1.2 | 1.3 | -2 | 4.2 |
| 37 | 4 | 2.6 | 1.4 | 2.0 | 1 | 0.9 |
| 55 | 2 | 3.1 | -1.1 | 1.2 | -1 | 1.1 |
| 62 | 5 | 3.3 | 1.7 | 2.9 | 2 | 3.8 |
- \(y\): Beobachteter Wert
- \(\hat y\): Vorhergesagter Wert
- \(e\): Residuum, Vorhersagefehler
- \(\bar y\): Mittelwert
- \(e_m\): Abweichung vom Mittelwert
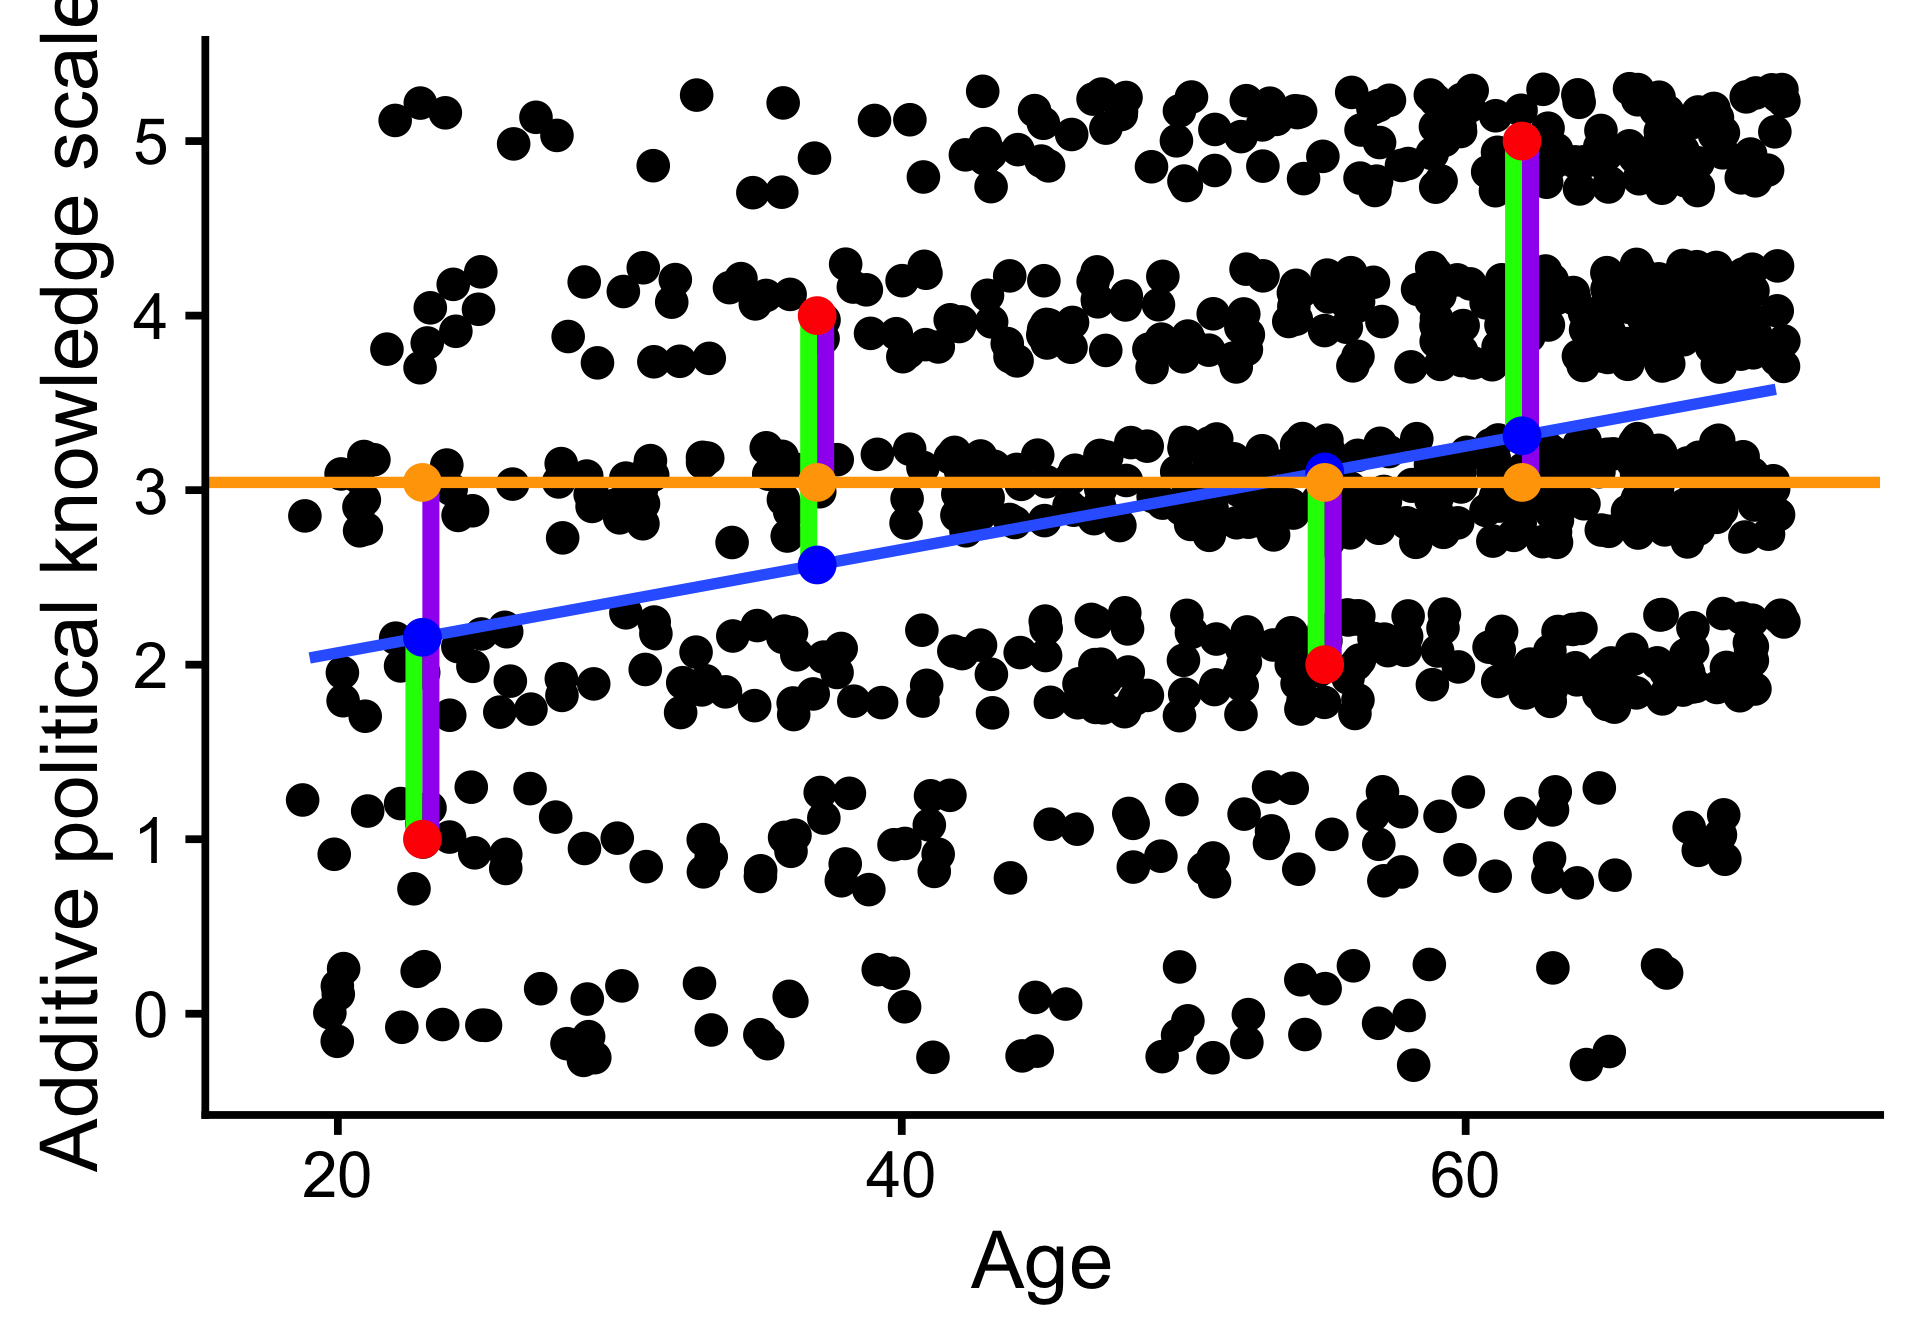
\(R^2 = \frac{\sum(y_i - \bar{y})^2 - \sum(y_i - \hat y)^2}{\sum(y_i - \bar{y})^2}\)
- \(R^2 = .09\): Anteil der Varianz, die das Regressionsmodell erklärt; 0 (Modell erklärt keine Varianz) bis 1 (perfekter linearer Zusammenhang). Vergleich mit Mittelwert als einfachstem Modell von \(y\).
Interpretation: Korrigiertes (adjusted) \(R^2\)
| Parameter | Coefficient | 95% CI | t(990) | p | Std. Coef. | Std. Coef. 95% CI | Fit |
|---|---|---|---|---|---|---|---|
| (Intercept) | 0.99 | (0.67, 1.31) | 6.07 | < .001 | 0.00 | (-0.06, 0.06) | |
| Age | 0.02 | (0.02, 0.03) | 8.24 | < .001 | 0.24 | (0.19, 0.30) | |
| Newspapers | 0.22 | (0.18, 0.27) | 9.31 | < .001 | 0.28 | (0.22, 0.33) | |
| R2 (adj.) | 0.16 |
- \(\text{korr. | adj. } R^2 = R^2 - \frac{n \times (1 - R^2)}{n - k - 1}\), mit Fallzahl \(n\) und Zahl der Prädiktoren \(k\)
- Maß für die Varianzerklärung des gesamten Regressionsmodells (aller Prädiktoren gemeinsam)
- 0 (Modell erklärt keine Varianz) bis 1 (aV ist perfekte Linearkombination der Prädikoren)
- Korrektur für den Umstand, dass die Linearkombination von vielen Prädiktoren Varianz in der unabhängigen Variable alleine dadurch erklärt, dass sie typisch für die Fälle in der Stichprobe ist.
Fragen?
Kategorielle Prädiktoren
Vergleiche Abschnitt Regression und Mittelwertvergleich in Einheit zur bivariaten linearen Regresssion
Modelle der heutigen Sitzung (hier: M1 & M4)
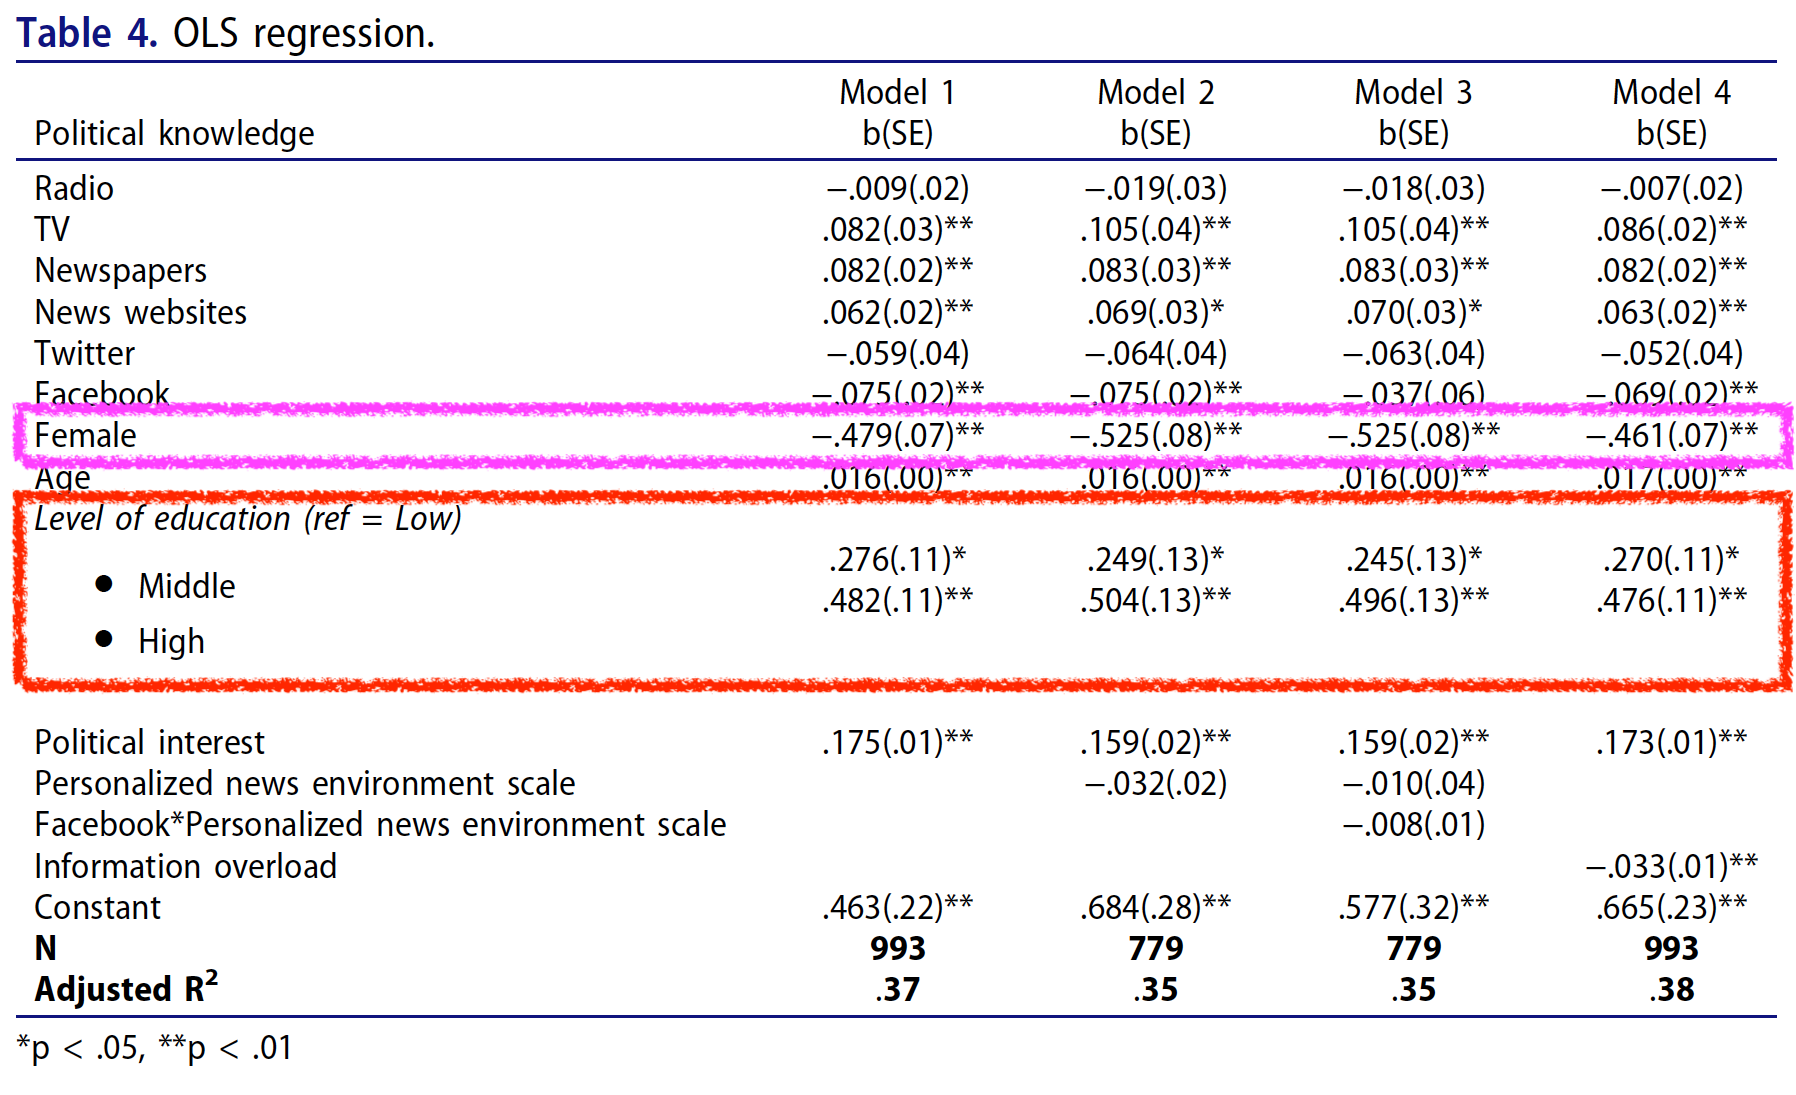
Kategorielle Prädiktoren
- Die lineare Regressionsanalyse (bzw. das allgemeine lineare Modell) ist ein sehr flexibles Werkzeug.
- Bekannte Verfahren zum Vergleich von Gruppenmittelwerten können als Spezialfälle der linearen Regression betrachtet werden. Sie sind statistisch äquivalent, für spezifische Anwendungen teils einfacher zu verwenden.
- T-Test: Vergleich von 2 Gruppenmittelwerten
- Varianzanalyse: Traditionelle mehrfaktorielle Experimentaldesigns
- Für alle weitergehenden Analysen sind die lineare Regression und ihre Erweiterungen zu empfehlen, da sie flexibel angepasst werden können.
- Erweiterung des bisherigen Modells zur Erklärung von politischem Wissen um zwei kategorielle Prädiktoren:
- Wiederholung: Gender (zweistufig, binär)
- Education (dreistufig, ordinal)
Wiederholung: Binäre Prädiktoren (Beispiel)
- \(\text{Gender}\) wird in eine Dummy-Variable \(\text{female}\) recodiert (0 = not female [hier: male], 1 = female)
- Regressionsgerade: \(Y = b_0 + b_1 \times \text{female} + \varepsilon\)
- Wenn \(\text{female} = 0\): \(Y = b_0 + \varepsilon\)
- \(b_0\) ist Mittelwert der Männer
- \(b_1\) ist Differenz zwischen Männern und Frauen
Regression
| Parameter | Coefficient | 95% CI | t(991) | p | Fit |
|---|---|---|---|---|---|
| (Intercept) | 3.44 | (3.33, 3.55) | 60.48 | < .001 | |
| Gender (female) | -0.84 | (-1.00, -0.67) | -10.14 | < .001 | |
| R2 | 0.09 |
Prädiktoren mit \(k\) Ausprägungen
- um \(k\) Gruppen zu vergleichen, werden \(k-1\) Prädiktor-Variablen erstellt
- die \(k-1\) Variablen werden in das Modell aufgenommen: \(Y = b_0 + b_1 \times X_1 + b_2 \times X_2 + ... + b_{k-1} \times X_{k-1} + \varepsilon\).
- Bei Dummy-Codierung:
- in der Referenzgruppe (alle \(X_1 = X_2 = ... = 0\)) ergibt sich \(Y = b_0\)
- \(b_1\) ist die Differenz zwischen der Gruppe 1 und der Referenzgruppe, \(b_2\) die Differenz zwischen der Gruppe 2 und der Referenzgruppe, …
- \(k-1\) paarweise Vergleiche in einem Modell gleichzeitig
- Mehr Vergleiche: Modell mehrmals schätzen oder Post-Hoc-Tests
Dummy-Codierung mit \(k\) Ausprägungen (Beispiel)
Niedrige Bildung als Referenz
Dummy-Variablen
| Zugehörigkeit | Middle | High |
|---|---|---|
| Lower | 0 | 0 |
| Middle | 1 | 0 |
| High | 0 | 1 |
Mittelwerte
| Lower | Middle | High |
|---|---|---|
| 2.58 | 2.97 | 3.25 |
Regression
| Parameter | Coefficient | 95% CI | t(990) | p | Fit |
|---|---|---|---|---|---|
| (Intercept) | 2.58 | (2.35, 2.81) | 22.39 | < .001 | |
| Education (Middle) | 0.39 | (0.13, 0.65) | 2.92 | 0.004 | |
| Education (High) | 0.67 | (0.41, 0.93) | 5.09 | < .001 | |
| R2 (adj.) | 0.03 |
Mittlere Bildung als Referenz
Dummy-Variablen
| Zugehörigkeit | Lower | High |
|---|---|---|
| Middle | 0 | 0 |
| Lower | 1 | 0 |
| High | 0 | 1 |
Mittelwerte
| Lower | Middle | High |
|---|---|---|
| 2.58 | 2.97 | 3.25 |
Regression
| Parameter | Coefficient | 95% CI | t(990) | p | Fit |
|---|---|---|---|---|---|
| (Intercept) | 2.97 | (2.84, 3.10) | 44.41 | < .001 | |
| Education (Lower) | -0.39 | (-0.65, -0.13) | -2.92 | 0.004 | |
| Education (High) | 0.28 | (0.10, 0.46) | 3.03 | 0.002 | |
| R2 (adj.) | 0.03 |
Alternative: Post-Hoc-Vergleiche
- Erst Modell schätzen, dann relevante (oder alle) Vergleiche betrachten
| Contrast | Estimate | Std. Error | z | Pr(>|z|) | S | 2.5 % | 97.5 % |
|---|---|---|---|---|---|---|---|
| Type: response | |||||||
| High - Lower | 0.669 | 0.131 | 5.09 | < 0.001 | 21.4 | 0.4109 | 0.926 |
| High - Middle | 0.279 | 0.092 | 3.03 | 0.00241 | 8.7 | 0.0988 | 0.459 |
| Middle - Lower | 0.389 | 0.133 | 2.92 | 0.00348 | 8.2 | 0.1282 | 0.651 |
- Korrektur der p-Werte für Mehrfach-Vergleiche (hier: nach Bonferroni) wird empfohlen, um \(\alpha\)-Fehler durch viele Vergleiche unwahrscheinlicher zu machen.
| Estimate | Std. Error | z | Pr(>|z|) | S | 2.5 % | 97.5 % |
|---|---|---|---|---|---|---|
| 0.669 | 0.131 | 5.09 | < 0.001 | 19.8 | 0.3619 | 0.975 |
| 0.279 | 0.092 | 3.03 | 0.00724 | 7.1 | 0.0645 | 0.494 |
| 0.389 | 0.133 | 2.92 | 0.01045 | 6.6 | 0.0785 | 0.700 |
Fragen?
“Große” Regressionsmodelle
Zu reproduzierende Modelle (hier: M1 & M4)
Modelle schätzen
m1 <- lm(Political_knowledge ~ Radio + Television + Newspapers + Online_news_sites + Twitter +
  Facebook + Gender + Age + Education + Political_interest, data = d)

m4 <- lm(Political_knowledge ~ Radio + Television + Newspapers + Online_news_sites + Twitter +
  Facebook + Gender + Age + Education + Political_interest + Information_overload, data = d)
Models 1 & 4
| Model 1 | Model 4 | |
|---|---|---|
| (Intercept) | 0.46 (0.22)* | 0.67 (0.23)** |
| Radio | -0.01 (0.02) | -0.01 (0.02) |
| Television | 0.08 (0.03)** | 0.09 (0.03)** |
| Newspapers | 0.08 (0.02)*** | 0.08 (0.02)*** |
| Online_news_sites | 0.06 (0.02)** | 0.06 (0.02)** |
| -0.06 (0.04) | -0.05 (0.04) | |
| -0.07 (0.02)*** | -0.07 (0.02)*** | |
| Genderfemale | -0.48 (0.07)*** | -0.46 (0.07)*** |
| Age | 0.02 (0.00)*** | 0.02 (0.00)*** |
| EducationMiddle | 0.28 (0.11)* | 0.27 (0.11)* |
| EducationHigh | 0.48 (0.11)*** | 0.48 (0.11)*** |
| Political_interest | 0.18 (0.01)*** | 0.17 (0.01)*** |
| Information_overload | -0.03 (0.01)** | |
| Num.Obs. | 993 | 993 |
| R2 Adj. | 0.371 | 0.376 |
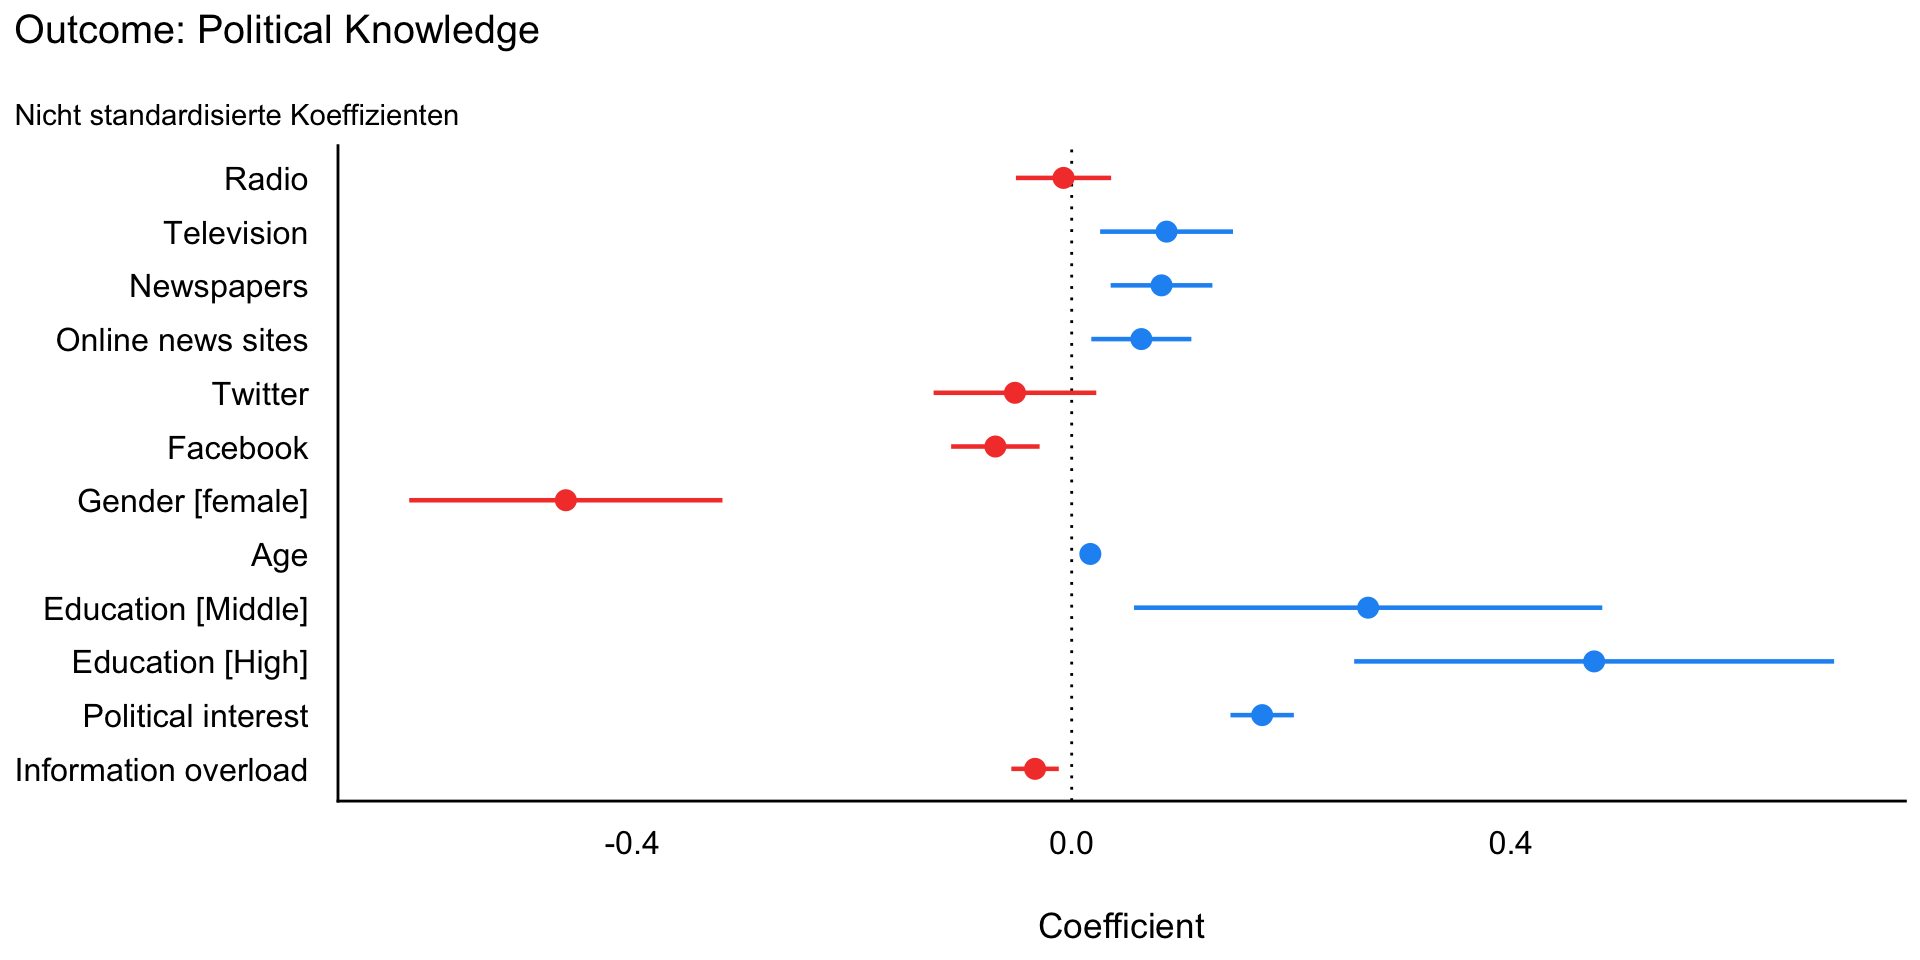
Model 4: Ausführliche Regressionstabelle
| Parameter | Coefficient | 95% CI | t(980) | p | Std. Coef. | Std. Coef. 95% CI | Fit |
|---|---|---|---|---|---|---|---|
| (Intercept) | 0.67 | (0.21, 1.12) | 2.90 | 0.004 | -0.08 | (-0.22, 0.06) | |
| Radio | -0.01 | (-0.05, 0.04) | -0.34 | 0.736 | -0.01 | (-0.06, 0.05) | |
| Television | 0.09 | (0.03, 0.15) | 2.80 | 0.005 | 0.08 | (0.03, 0.14) | |
| Newspapers | 0.08 | (0.04, 0.13) | 3.46 | < .001 | 0.10 | (0.04, 0.16) | |
| Online news sites | 0.06 | (0.02, 0.11) | 2.73 | 0.006 | 0.08 | (0.02, 0.14) | |
| -0.05 | (-0.13, 0.02) | -1.37 | 0.171 | -0.04 | (-0.09, 0.02) | ||
| -0.07 | (-0.11, -0.03) | -3.38 | < .001 | -0.10 | (-0.16, -0.04) | ||
| Gender (female) | -0.46 | (-0.60, -0.32) | -6.34 | < .001 | -0.34 | (-0.44, -0.23) | |
| Age | 0.02 | (0.01, 0.02) | 6.03 | < .001 | 0.17 | (0.12, 0.23) | |
| Education (Middle) | 0.27 | (0.06, 0.48) | 2.48 | 0.013 | 0.20 | (0.04, 0.35) | |
| Education (High) | 0.48 | (0.26, 0.69) | 4.27 | < .001 | 0.35 | (0.19, 0.51) | |
| Political interest | 0.17 | (0.14, 0.20) | 11.79 | < .001 | 0.34 | (0.28, 0.39) | |
| Information overload | -0.03 | (-0.05, -0.01) | -3.03 | 0.003 | -0.08 | (-0.13, -0.03) | |
| R2 (adj.) | 0.38 |
Model 4: Koeffizientenplot nicht standardisiert
Model 4: Koeffizientenplot standardisiert
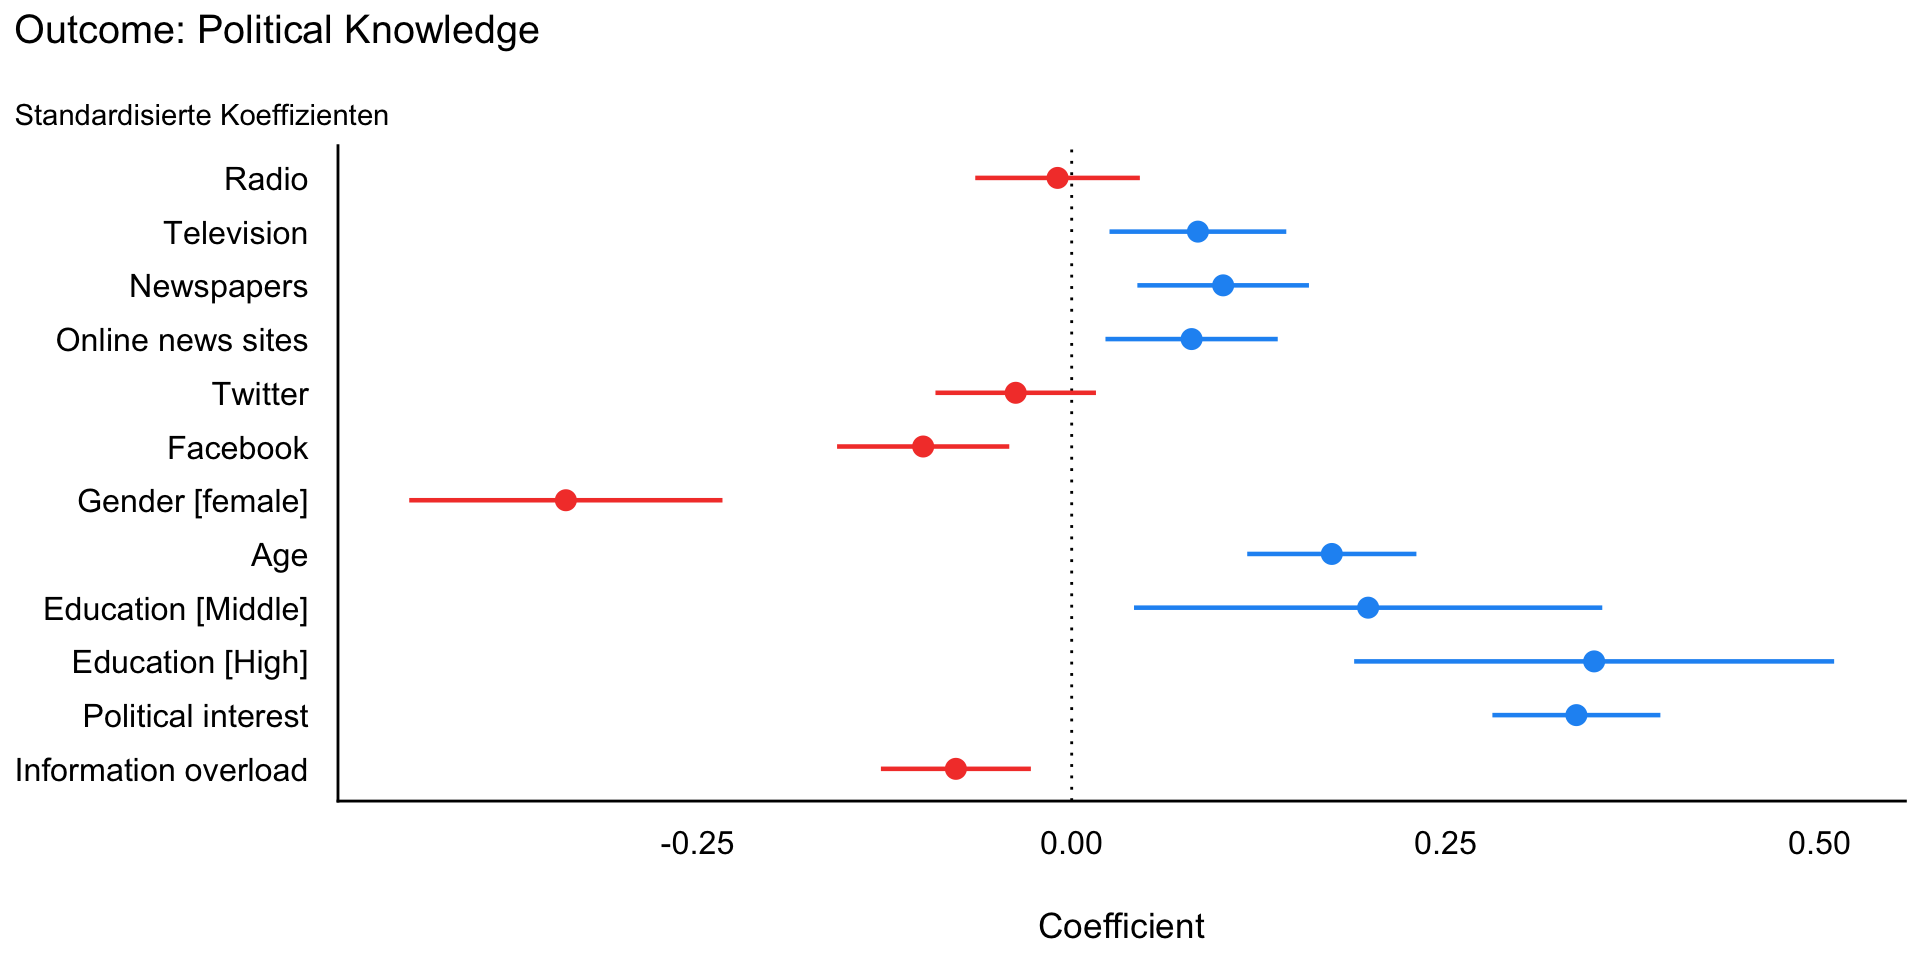
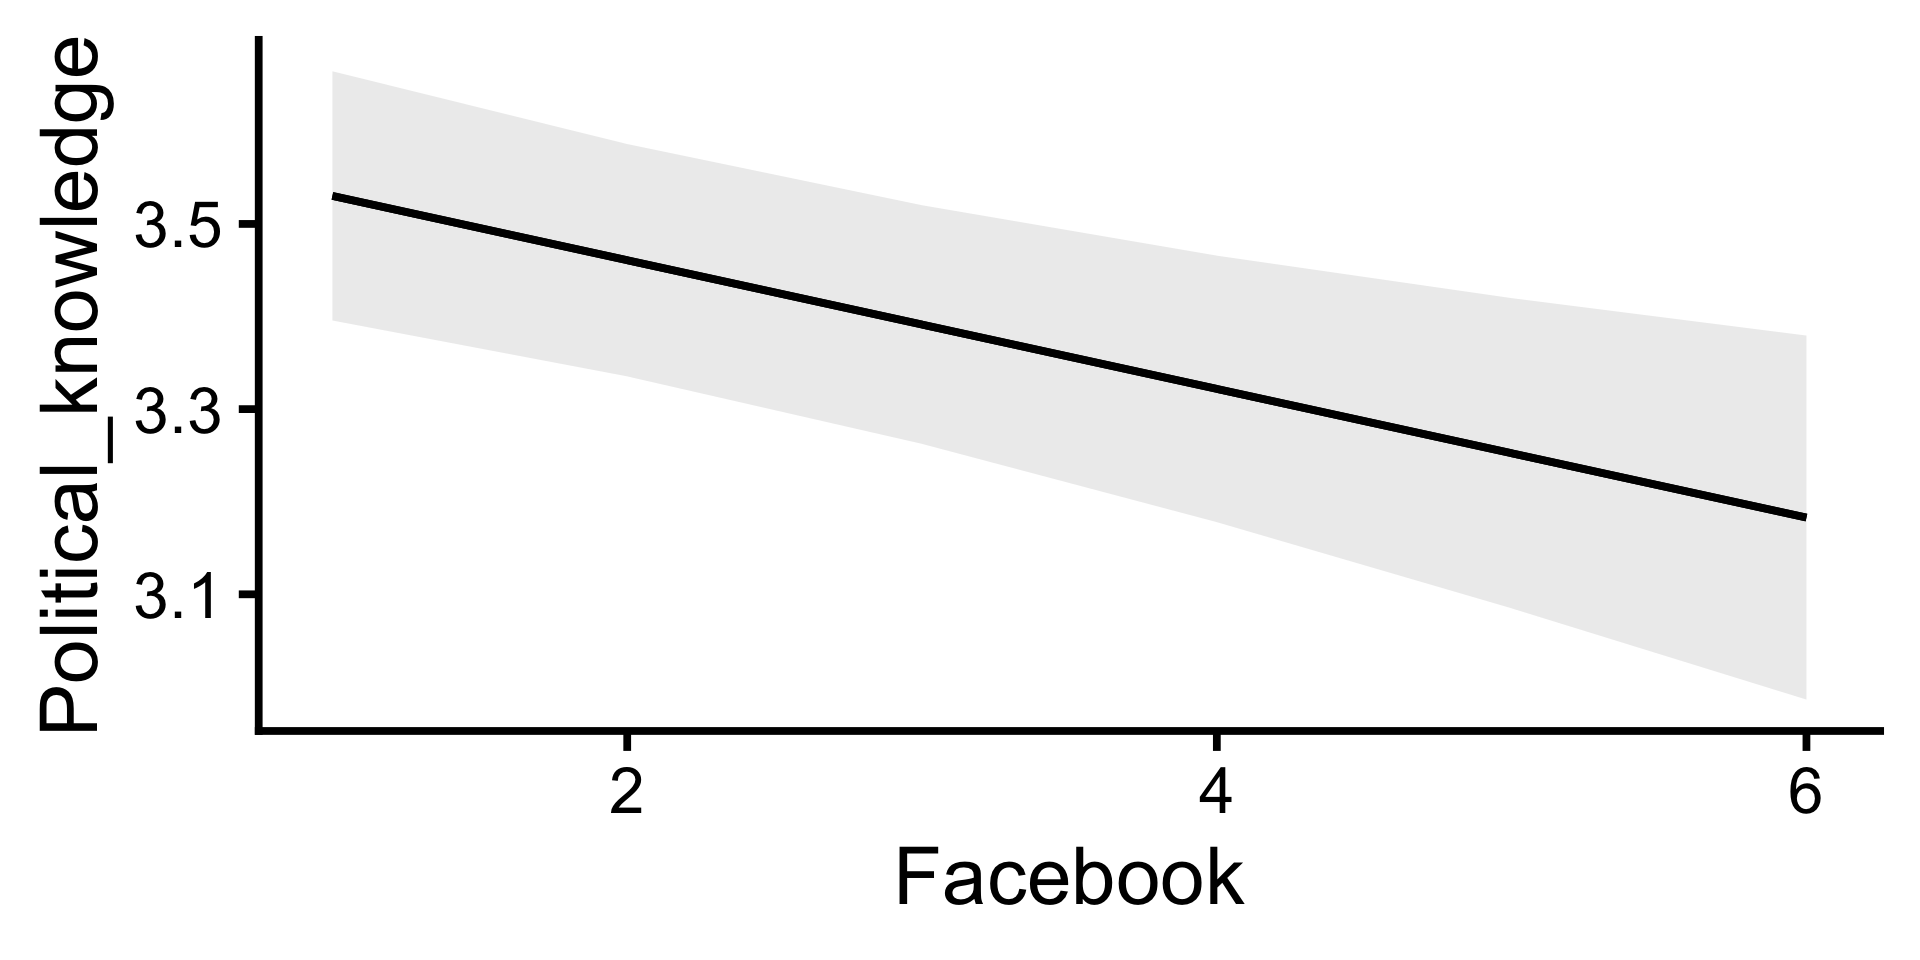
Model 4: Vorhersage für einzelne Prädiktoren
| Estimate | Std. Error | z | Pr(>|z|) | S | 2.5 % | 97.5 % | |
|---|---|---|---|---|---|---|---|
| Type: response | |||||||
| 1 | 3.53 | 0.0687 | 51.4 | <0.001 | Inf | 3.40 | 3.66 |
| 2 | 3.46 | 0.0640 | 54.1 | <0.001 | Inf | 3.34 | 3.59 |
| 3 | 3.39 | 0.0657 | 51.6 | <0.001 | Inf | 3.26 | 3.52 |
| 4 | 3.32 | 0.0734 | 45.2 | <0.001 | Inf | 3.18 | 3.47 |
| 5 | 3.25 | 0.0855 | 38.1 | <0.001 | 1050.3 | 3.08 | 3.42 |
| 6 | 3.18 | 0.1003 | 31.7 | <0.001 | 731.9 | 2.99 | 3.38 |
- Vorhergesagte Werte, wenn andere Prädiktoren den Mittelwert bzw. Modus haben.
Model 4: Vergleiche für einzelne Prädiktoren
| Term | Contrast | Estimate | Std. Error | z | Pr(>|z|) | S | 2.5 % | 97.5 % |
|---|---|---|---|---|---|---|---|---|
| Type: response | ||||||||
| Education | High - Lower | 0.476 | 0.1114 | 4.27 | < 0.001 | 15.7 | 0.2575 | 0.694 |
| Education | High - Middle | 0.206 | 0.0757 | 2.72 | 0.00654 | 7.3 | 0.0575 | 0.354 |
| Education | Middle - Lower | 0.270 | 0.1086 | 2.48 | 0.01297 | 6.3 | 0.0570 | 0.483 |
| (x + sd) - (x - sd) | -0.270 | 0.0799 | -3.38 | < 0.001 | 10.5 | -0.4271 | -0.114 | |
| Gender | female - male | -0.461 | 0.0727 | -6.34 | < 0.001 | 32.0 | -0.6030 | -0.318 |
| Newspapers | (x + sd) - (x - sd) | 0.276 | 0.0796 | 3.46 | < 0.001 | 10.9 | 0.1198 | 0.432 |
Average counterfactual comparison
- Compute predictions for every row of the dataset in the counterfactual world where all observations belong to the treatment condition.
- Compute predictions for every row of the dataset in the counterfactual world where all observations belong to the control condition.
- Take the differences between the two vectors of predictions.
- Average the unit-level estimates across the whole dataset, or within subgroups.
Fragen?
Annahmen und ihre Überprüfung
Siehe Einheit zur bivariaten linearen Regression für Details
Annahmen und ihre Überprüfung
Statistische Annahmen
- Linearität und Additivität der Zusammenhänge
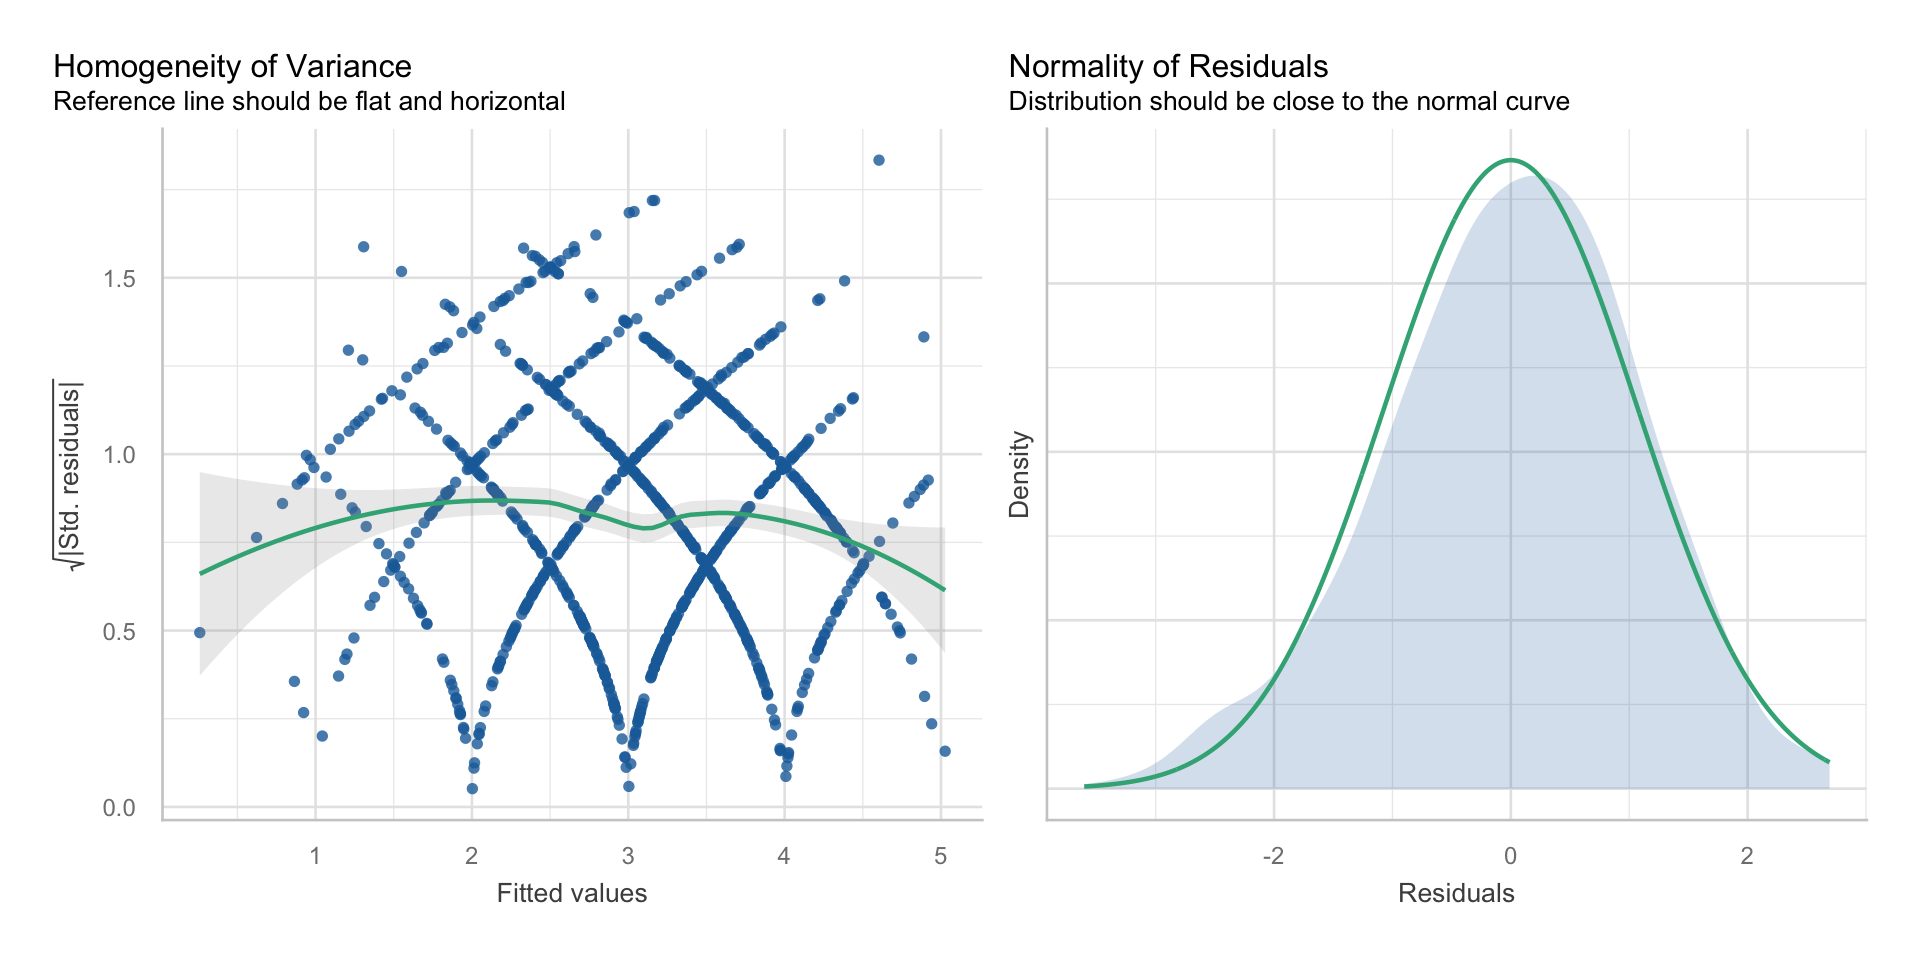
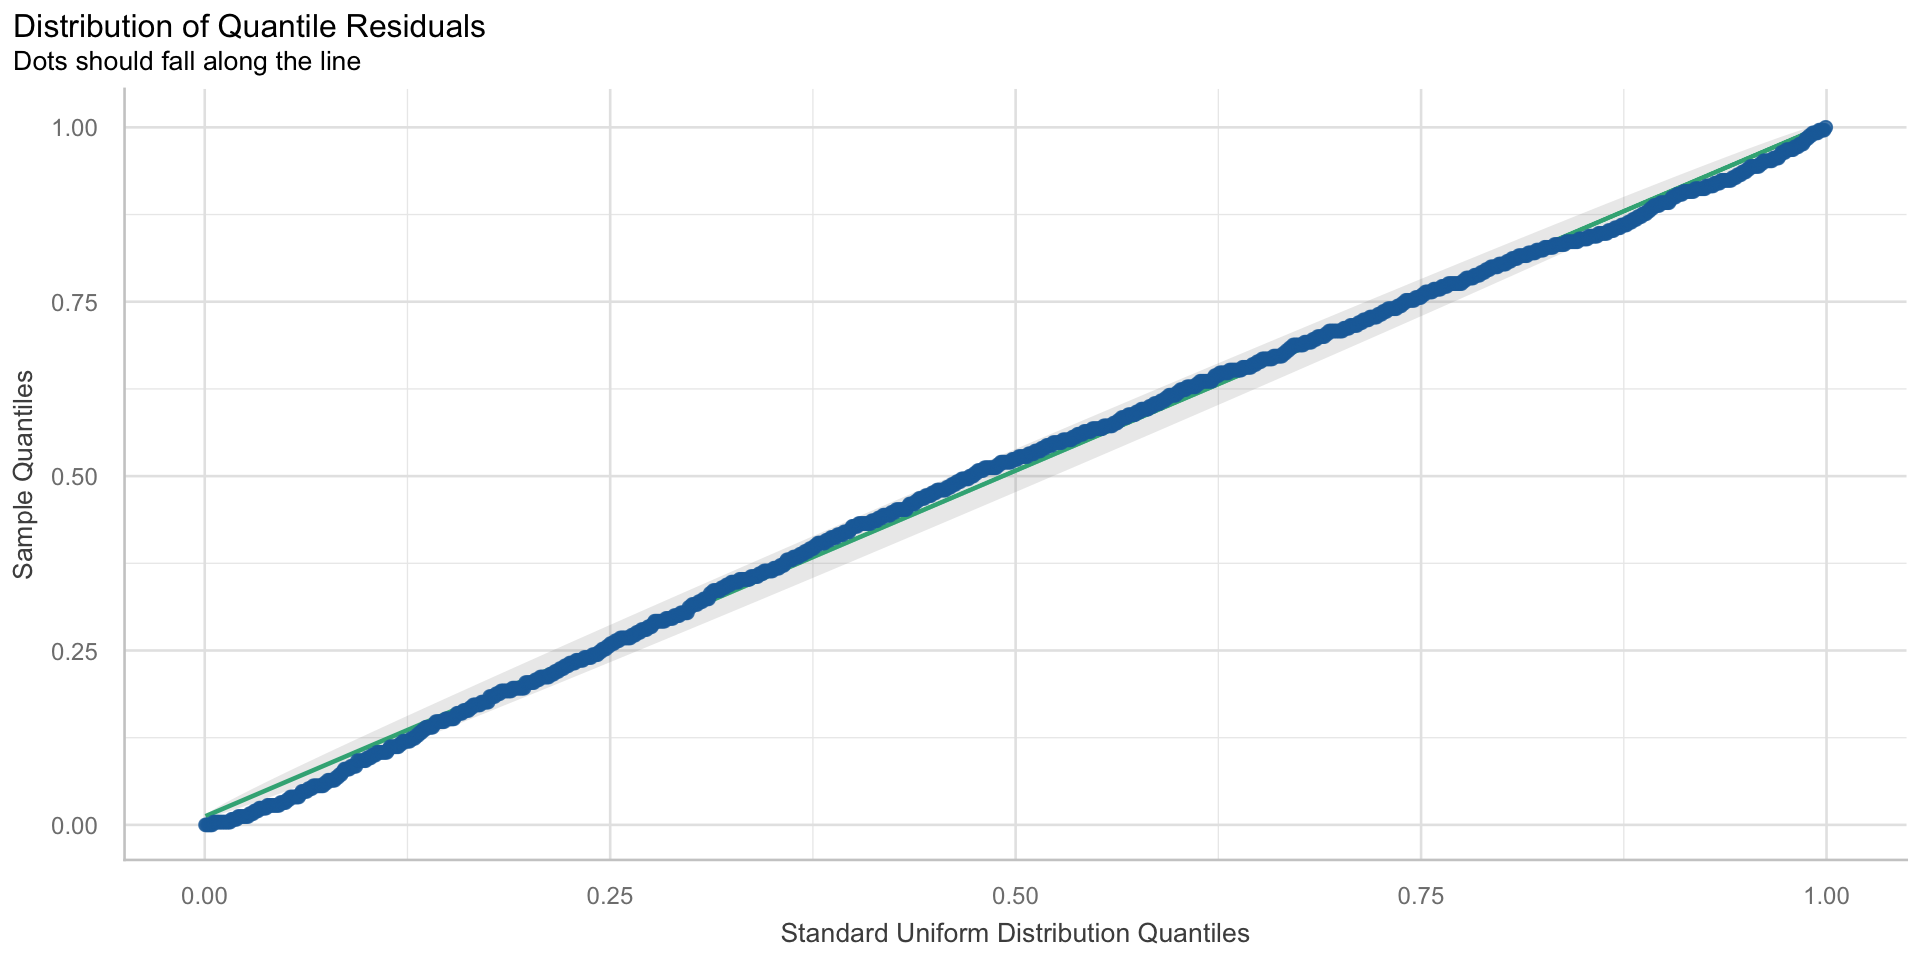
- Normalverteilung und Homoskedastizität der Residuen
- Unabhängigkeit der Residuen
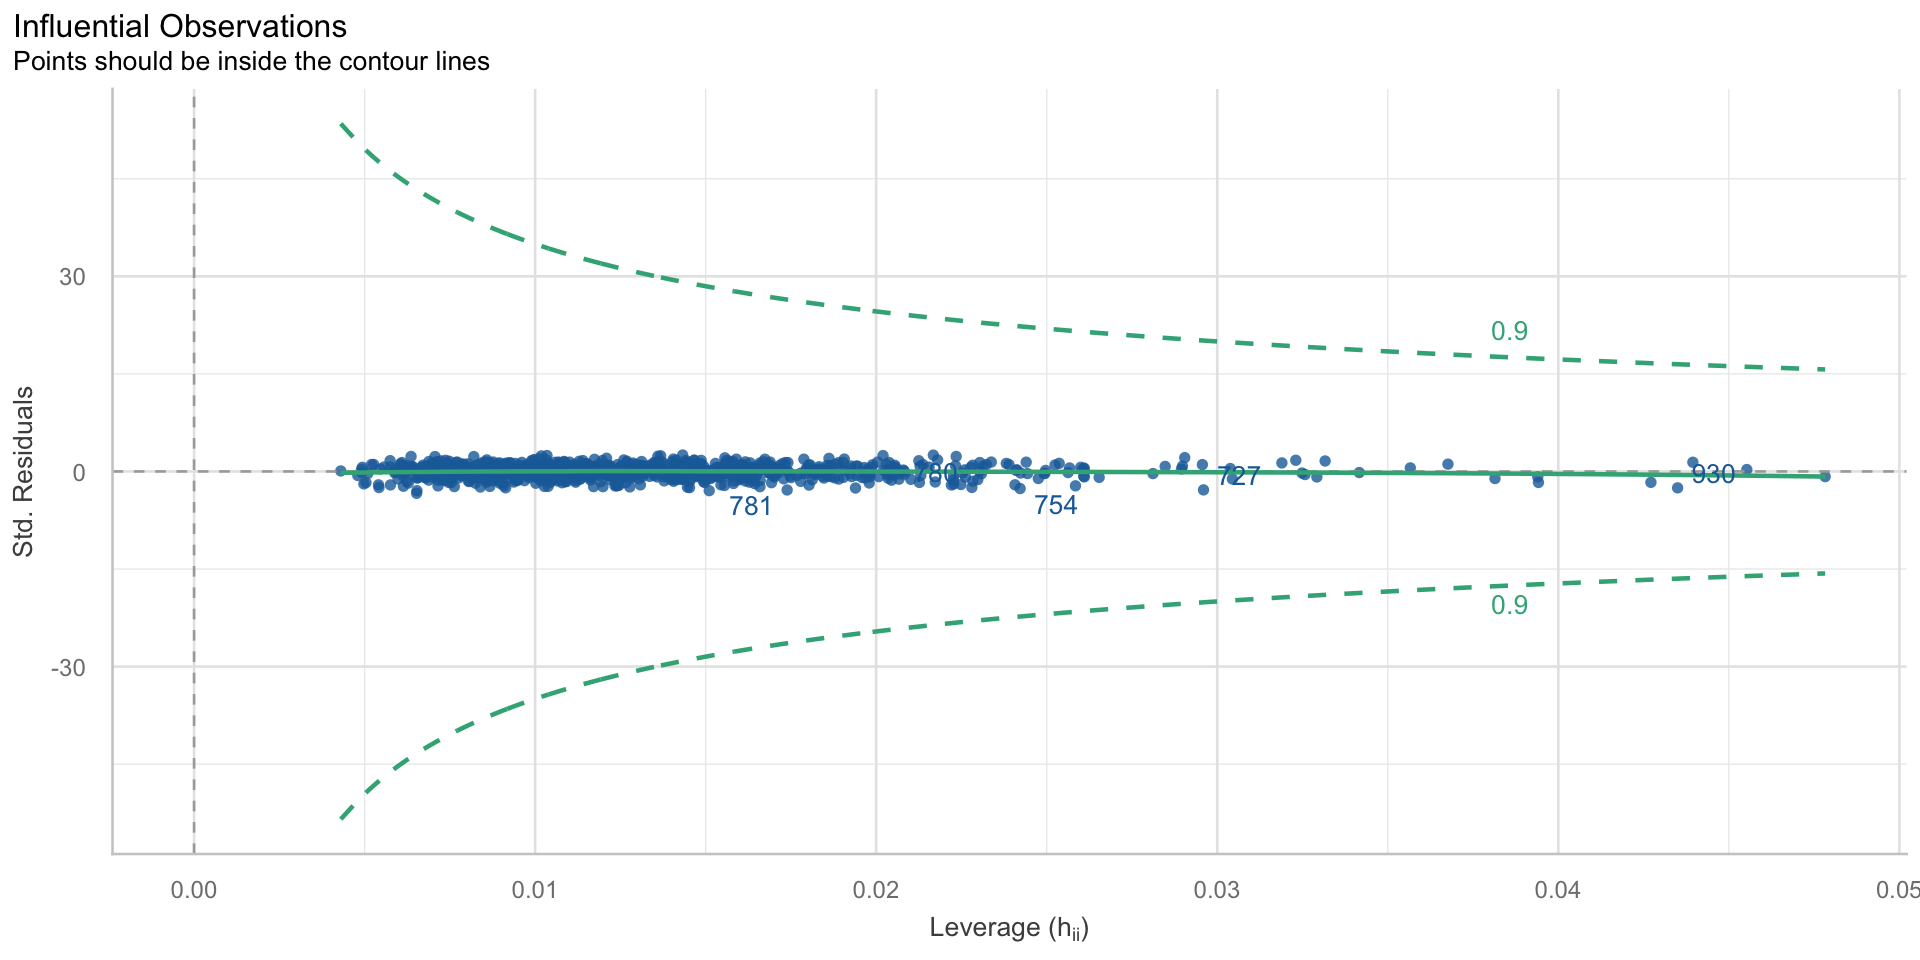
- keine einflussreichen Ausreißer
- keine Multikollinearität
Kausalannahmen
- korrekt spezifiziertes Modell; keine fehlenden oder überflüssigen Variablen
- Besprechen wir in eigener Einheit
Model 4 aus Van Erkel & Van Aelst (2021)
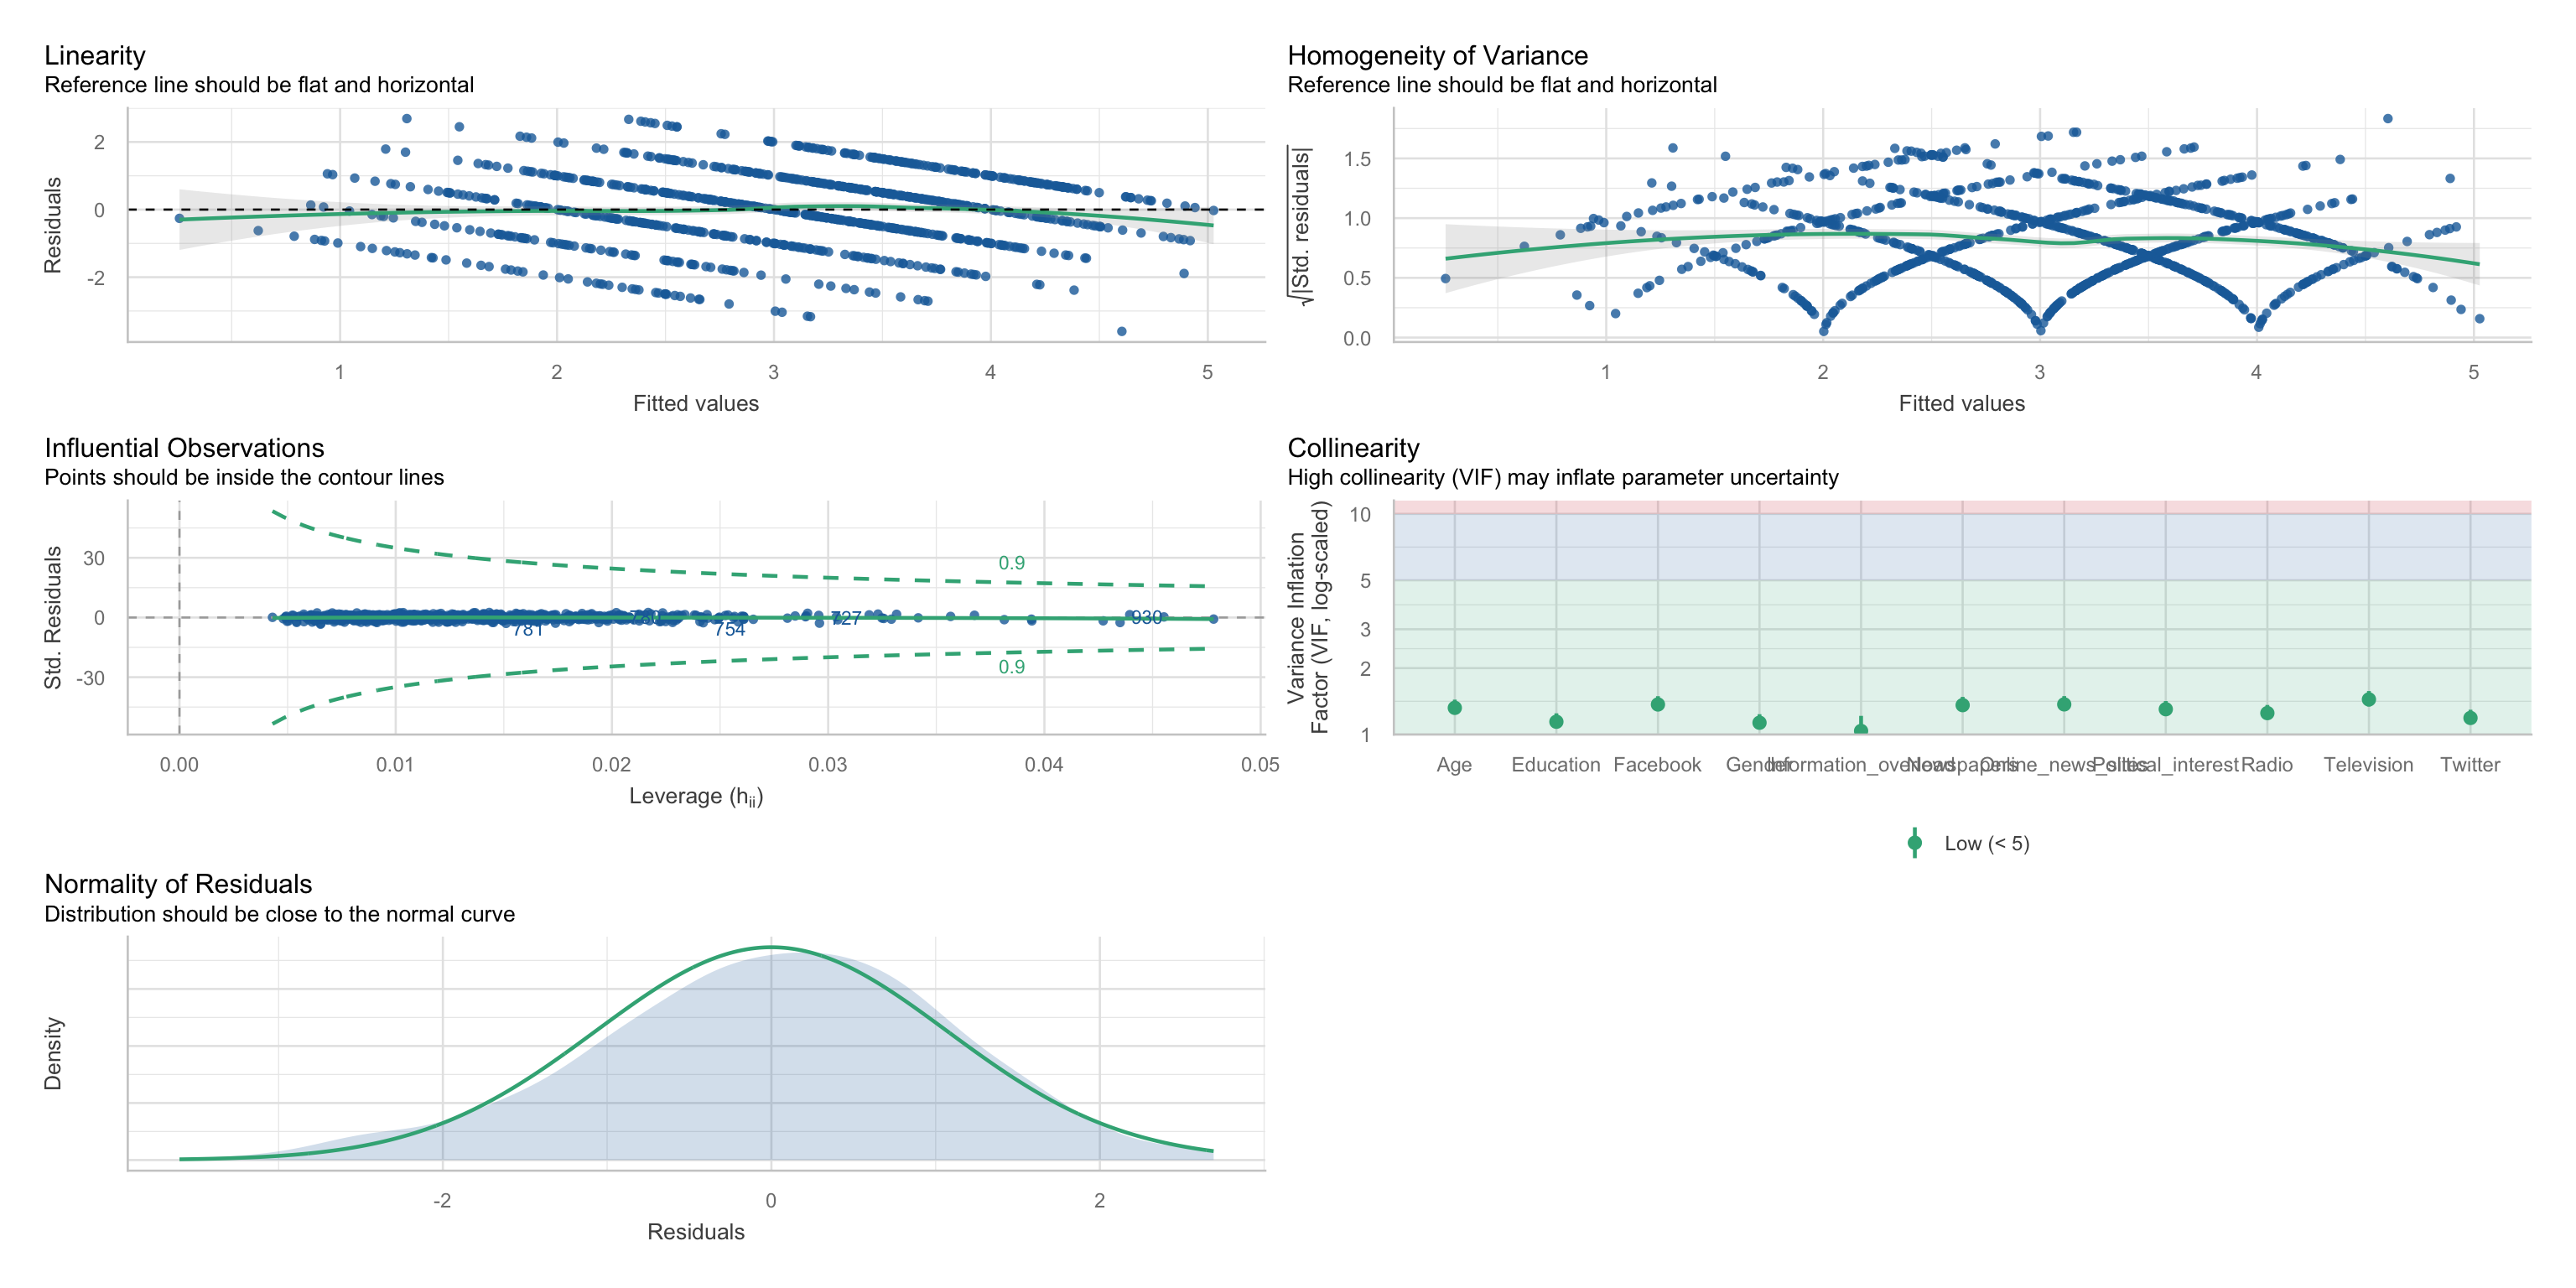
Linearität
$NCV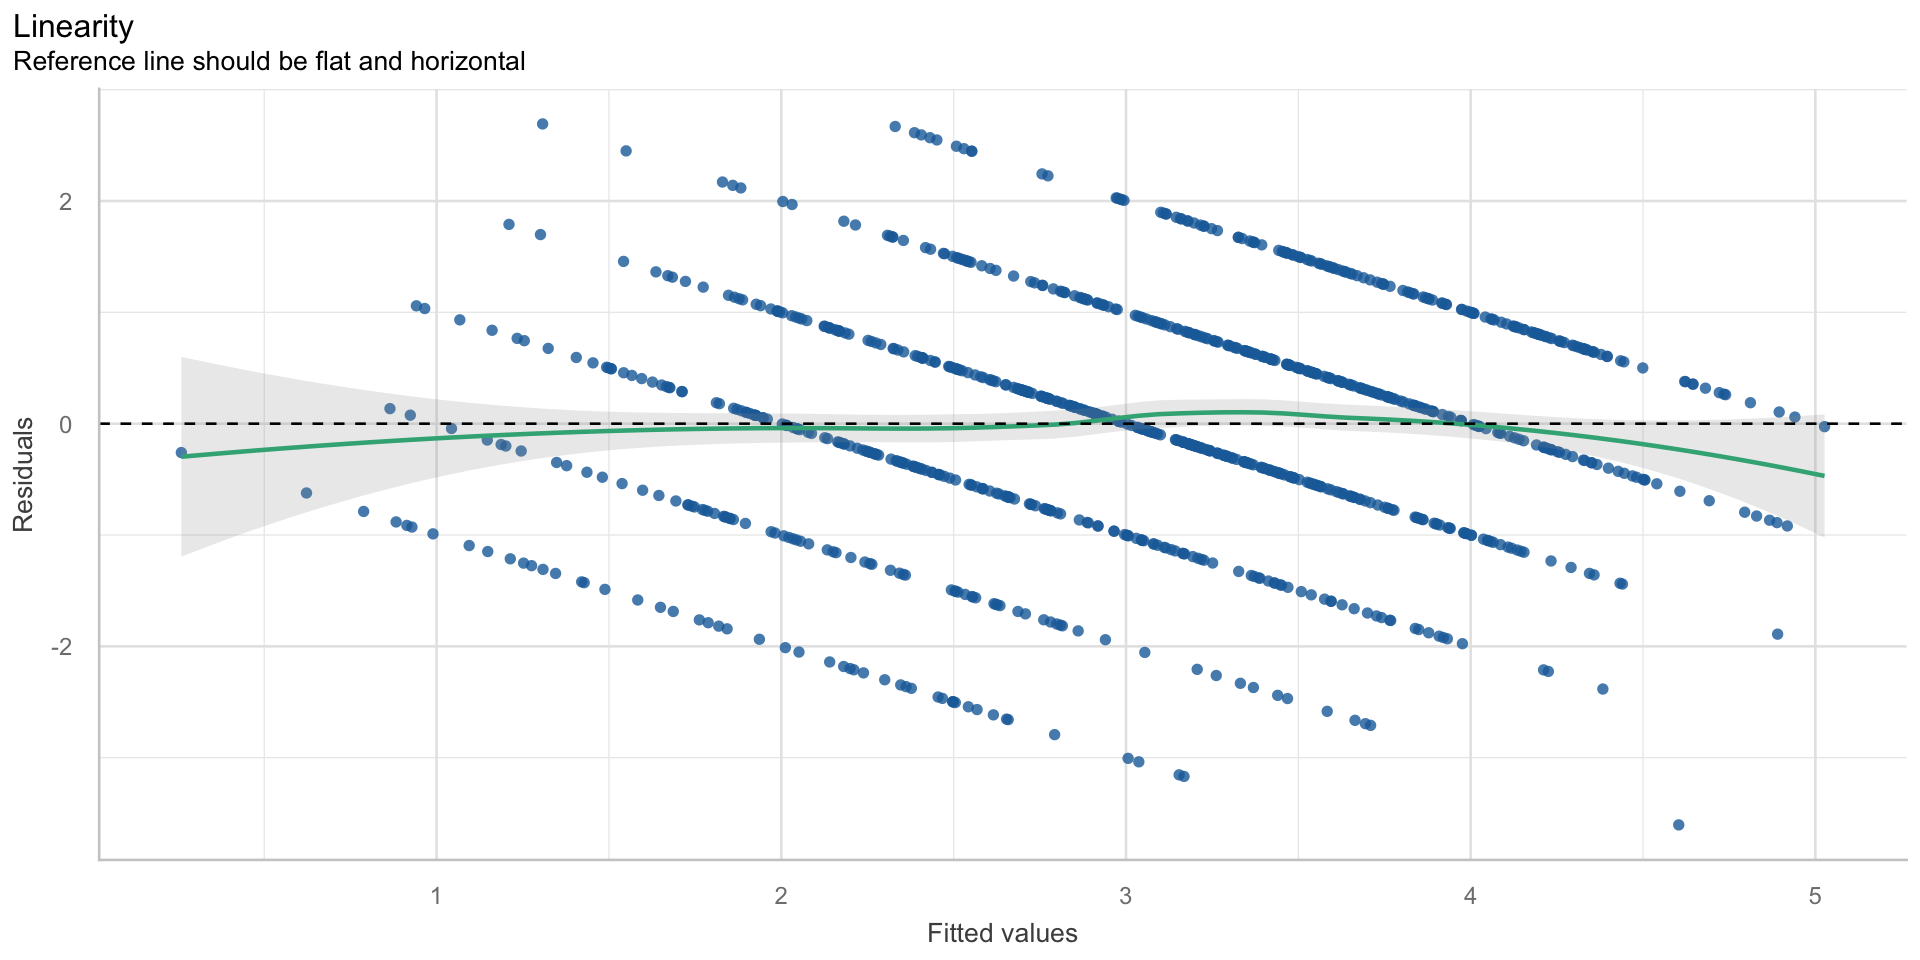
Normalverteilung und Homoskedastizität der Residuen
Unabhängigkeit der Residuen
keine einflussreichen Ausreißer
Keine Multikollinearität
- Annahme: Prädiktorvariablen \(X\) korrelieren nicht zu stark miteinander
- Diagnose: Korrelationsmatrix der Prädiktoren, Variance Inflation Factor (VIF)
- Verletzung: Prädiktorvariablen korrelieren stark miteinander
- Konsequenz der Verletzung: falsche Standardfehler, ineffiziente Schätzung
- Lösung: Ggf. Ausschluss von Prädiktorvariablen, falls uns Koeffizient der betroffenen Prädiktoren überhaupt interessiert.
Multikollinearität I
| Parameter | Political_knowledge | Radio | Television | Newspapers | Online_news_sites | Age | Political_interest | Information_overload | ||
|---|---|---|---|---|---|---|---|---|---|---|
| Political_knowledge | 0.14*** | 0.26*** | 0.33*** | 0.22*** | -0.04 | -0.13*** | 0.30*** | 0.49*** | -0.09* | |
| Radio | 0.14*** | 0.39*** | 0.28*** | 0.22*** | 0.09 | 0.18*** | 0.05 | 0.20*** | 0.05 | |
| Television | 0.26*** | 0.39*** | 0.31*** | 0.28*** | 0.04 | 0.19*** | 0.24*** | 0.30*** | 0.08 | |
| Newspapers | 0.33*** | 0.28*** | 0.31*** | 0.33*** | 0.09 | 0.06 | 0.21*** | 0.33*** | 0.02 | |
| Online_news_sites | 0.22*** | 0.22*** | 0.28*** | 0.33*** | 0.23*** | 0.27*** | -0.08 | 0.32*** | 0.04 | |
| -0.04 | 0.09 | 0.04 | 0.09 | 0.23*** | 0.33*** | -0.15*** | 0.05 | 0.09 | ||
| -0.13*** | 0.18*** | 0.19*** | 0.06 | 0.27*** | 0.33*** | -0.25*** | 0.06 | 0.12** | ||
| Age | 0.30*** | 0.05 | 0.24*** | 0.21*** | -0.08 | -0.15*** | -0.25*** | 0.14*** | 0.05 | |
| Political_interest | 0.49*** | 0.20*** | 0.30*** | 0.33*** | 0.32*** | 0.05 | 0.06 | 0.14*** | -0.02 | |
| Information_overload | -0.09* | 0.05 | 0.08 | 0.02 | 0.04 | 0.09 | 0.12** | 0.05 | -0.02 |
p-value adjustment method: Holm (1979)
Multikollinearität II
$VIF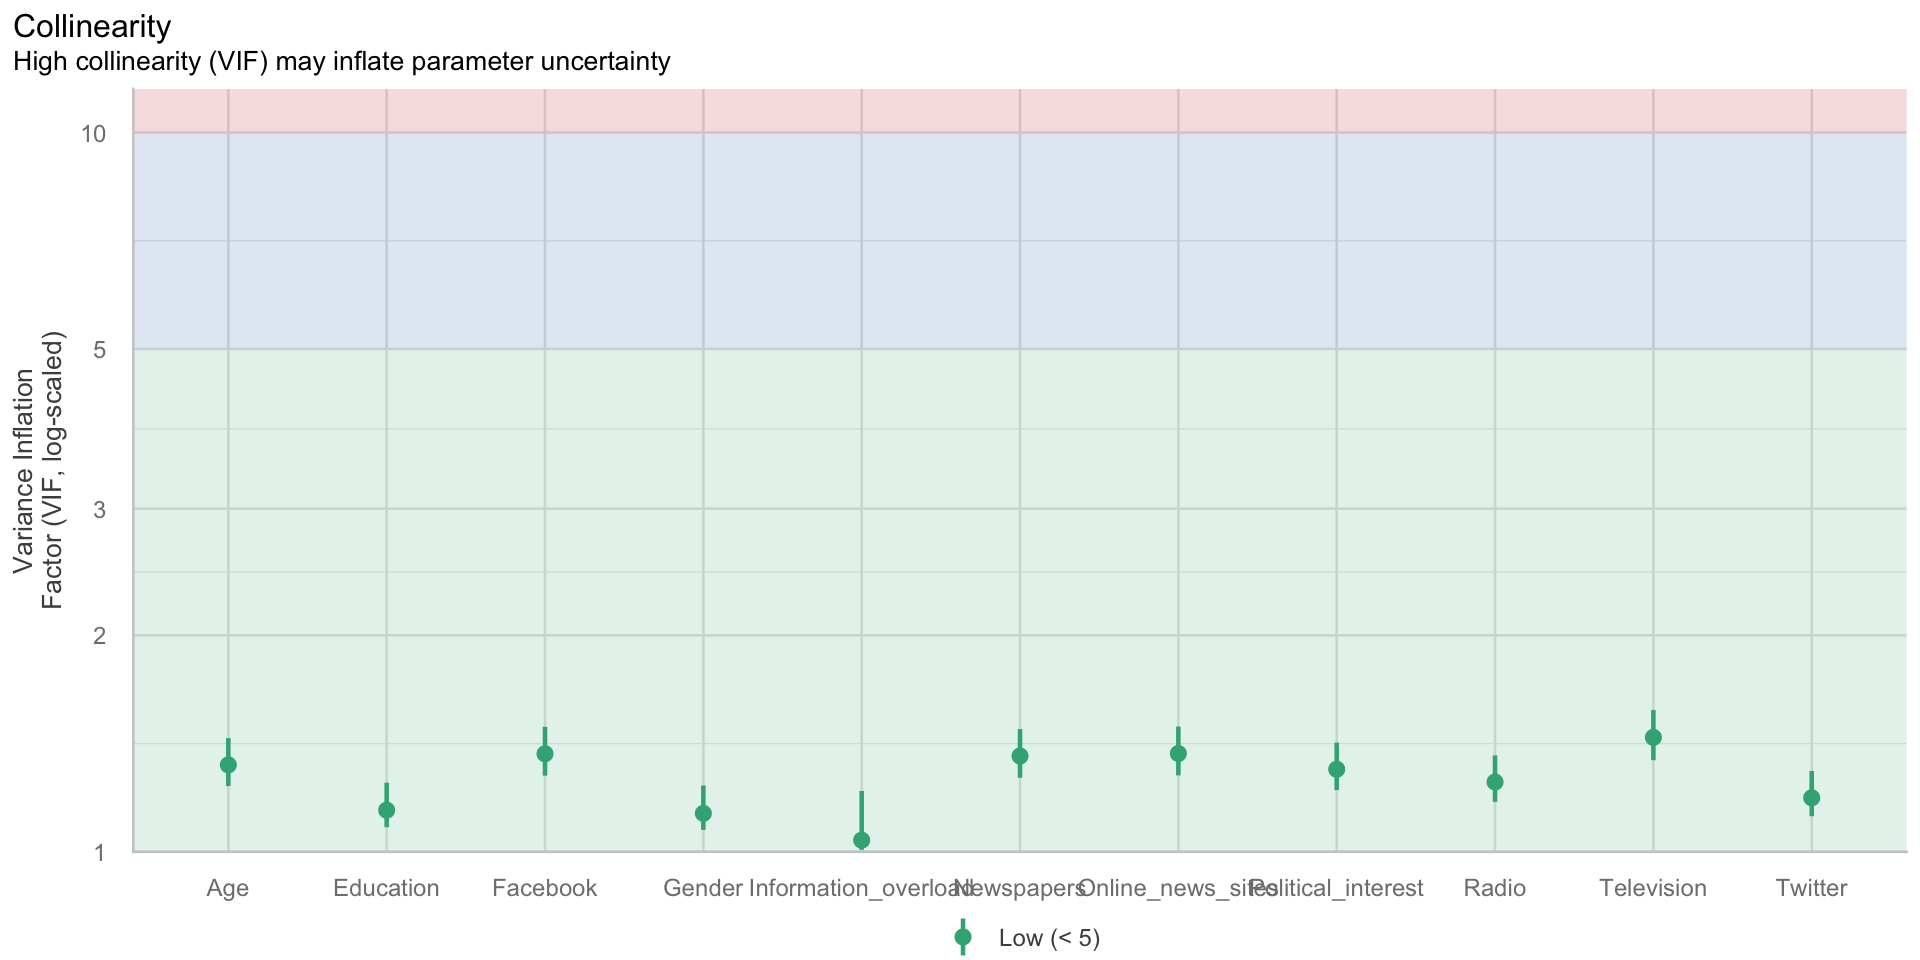
- Aber: Kalnins & Praitis Hill (2025): The VIF score. What is it good for? Absolutely nothing
- Korrelationen zwischen Prädiktoren sind zunächst ein empirischer Befund, mit dem wir umgehen müssen.
Fragen?
Übungsaufgaben
Fragen?
Nächste Einheit
Digitale Verhaltensdaten und Webtracking
Multiple lineare Regression III: Moderation
Danke — und erholsame Ferien 🎄
Marko Bachl
Literatur
Arel-Bundock, V. (2025). Model to meaning: How to interpret statistical models with R and Python (1. Aufl.). Chapman; Hall/CRC. https://doi.org/10.1201/9781003560333
Bortz, J., & Schuster, C. (2010). Statistik für Human- und Sozialwissenschaftler (7. Aufl.). Springer. https://doi.org/10.1007/978-3-642-12770-0
Kalnins, A., & Praitis Hill, K. (2025). The VIF score. What is it good for? Absolutely nothing. Organizational Research Methods, 28(1), 58–75. https://doi.org/pffj
Van Erkel, P. F. A. (2020). „Replication data for “Why don’t we learn from social media?" (Version V2) [Dataset]. Harvard Dataverse. https://doi.org/10.7910/DVN/D0COF1
Van Erkel, P. F. A., & Van Aelst, P. (2021). Why don’t we learn from social media? Studying effects of and mechanisms behind social media news use on general surveillance political knowledge. Political Communication, 38(4), 407–425. https://doi.org/ghk94s