Open Science
Methoden der empirischen Kommunikations- und Medienforschung
Warum Open Science?
OS als Reaktion auf Probleme

OS als Umsetzung wissenschaftlicher Prinzipien

Feeling the Future
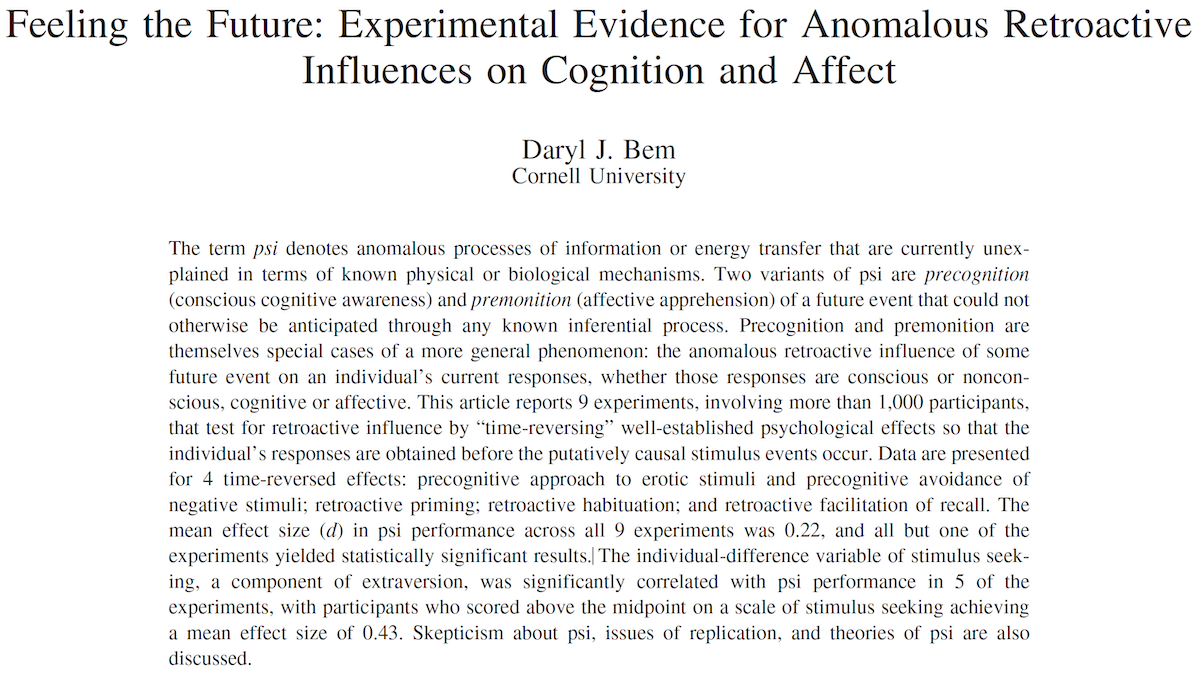
Design
- 9 unabhängige Experimentalstudien
- Mehr als 1,000 Versuchspersonen
Beispiel: Precognitive Detection of Erotic Stimuli
- Zwei virtuelle Vorhänge
- Raten: Hinter welchem Vorhang ist ein Bild?
- Position des Stimulus wird erst nach Raten durch Zufallsgenerator festgelegt.
- Vergleichsgruppen: Erotische und nicht-erotische Bilder
Feeling the Future
Your task is to click on the curtain that you feel has the picture behind it. The curtain will then open, permitting you to see if you selected the correct curtain.

Feeling the Future

“Across all 100 sessions, participants correctly identified the future position of the erotic pictures significantly more frequently than the 50% hit rate expected by chance: \(53.1\%\), \(t(99) = 2.51\), \(p = .01\), \(d = 0.25\).”
Feeling the Future

“In contrast, their hit rate on the nonerotic pictures did not differ significantly from chance: \(49.8\%\), \(t(99) = 0.15\), \(p=.56\). This was true across all types of nonerotic pictures: neutral pictures, \(49.6\%\); negative pictures, \(51.3\%\); positive pictures, \(49.4\%\); and romantic but nonerotic pictures, \(50.2\%\). (All \(t\) values \(<1\).) The difference between erotic and nonerotic trials was itself significant, \(t_{\text{diff}}(99) = 1.85\), \(p = .031\), \(d = 0.19\).”
Feeling the Future: Diskurs
- Ergebnisse stellen etablierte Naturgesetze infrage.
- Offiziell in einer der wichtigsten Fachzeitschriften für Psychologie publiziert; entspricht den methodischen Standards des Felds und der Zeit
Implikationen
- Precognition existiert (und wir können die Ergebnisse replizieren)
- Precognition existiert nicht (und die methodischen Standards sind ungenügend)
Feeling the Future: Diskurs
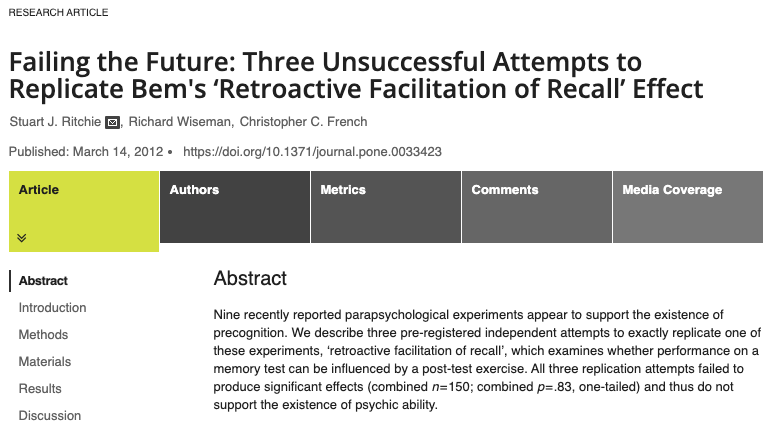
- Gleiches Design, gleiche Analyse
- “All three replication attempts failed to produce significant effects (combined n = 150; combined p = .83, one-tailed) and thus do not support the existence of psychic ability.”
- Von der Fachzeitschrift ohne Review abgelehnt: Keine Publikation von Replikationsstudien
Feeling the Future: Diskurs

Daryl Bem
“I’m all for rigor,” he continued, “but I prefer other people do it. I see its importance—it’s fun for some people—but I don’t have the patience for it.” It’s been hard for him, he said, to move into a field where the data count for so much. “If you looked at all my past experiments, they were always rhetorical devices. I gathered data to show how my point would be made. I used data as a point of persuasion, and I never really worried about, ‘Will this replicate or will this not?’”
Open Science Collaboration (2015)
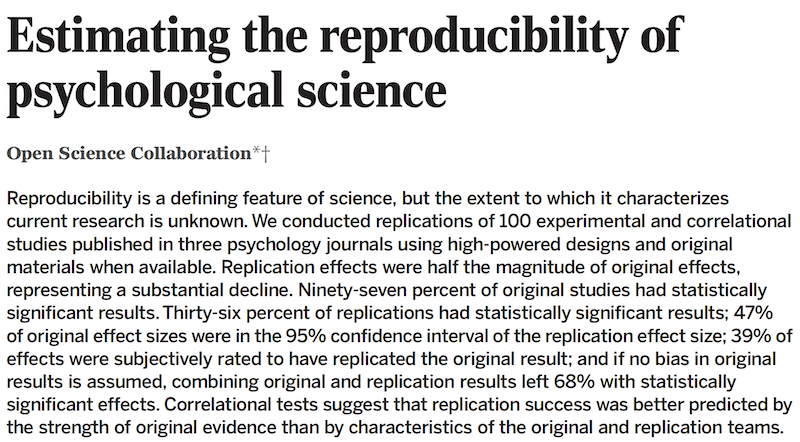
- Replikation von 100 “wichtigen” Studien aus der Psychologie
- 39% “erfolgreiche” Replikationen
- Durchschnittliche Effektstärke:
- Replikationsstudien: \(M_r = .2\)
- Originalstudien: \(M_r = .4\)
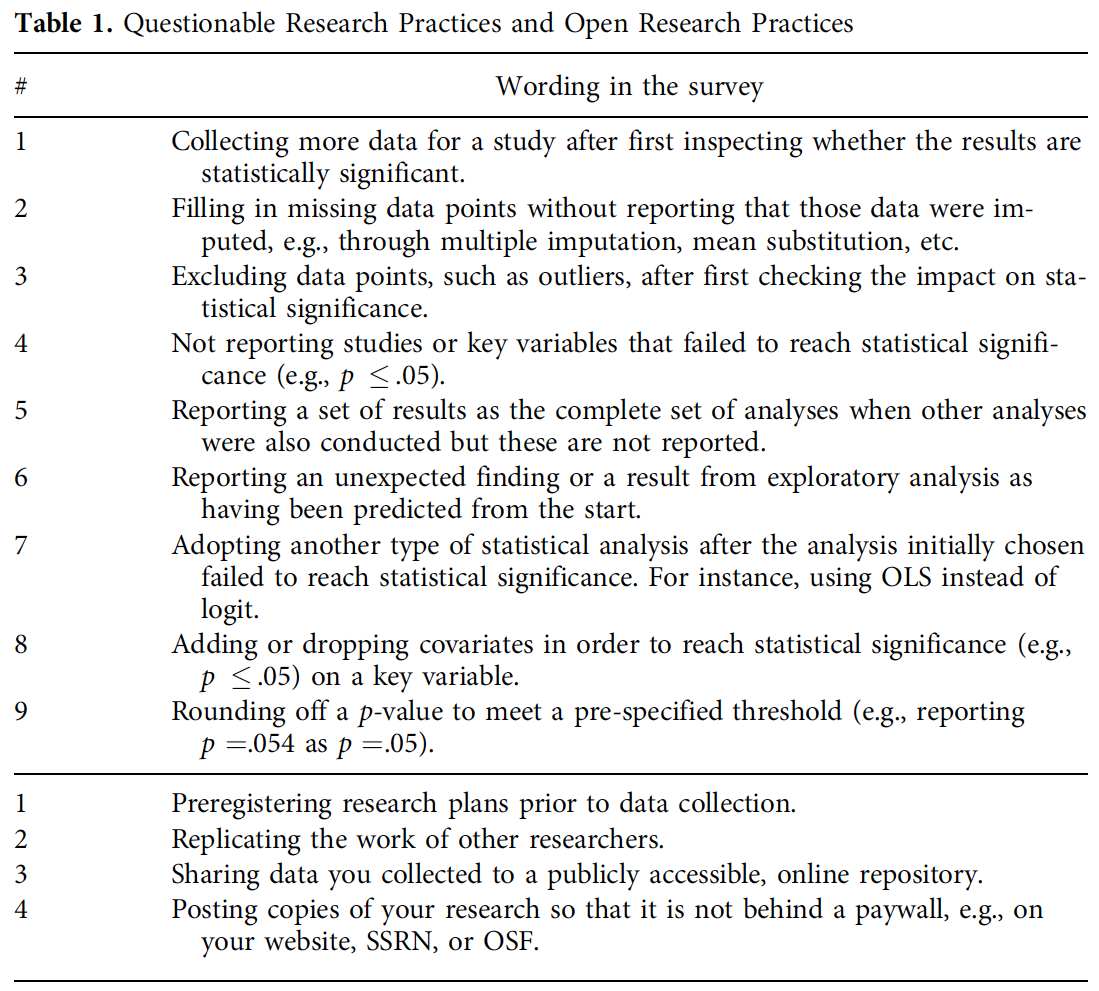
QRP 1: P-Hacking

Datenanalyse mit dem Ziel “statististischer Signifikanz” (p < .05)
Viele Variablen erheben
Viele Varianten der Datenaufbereitung testen
Viele Analysen durchführen
Fälle aus Analyse ausschließen
Weitere Fälle erheben
Während der Studie auswerten und abhängig von Zwischenergebnis stoppen
Am Ende: Selektiv berichten, was “funktioniert” hat
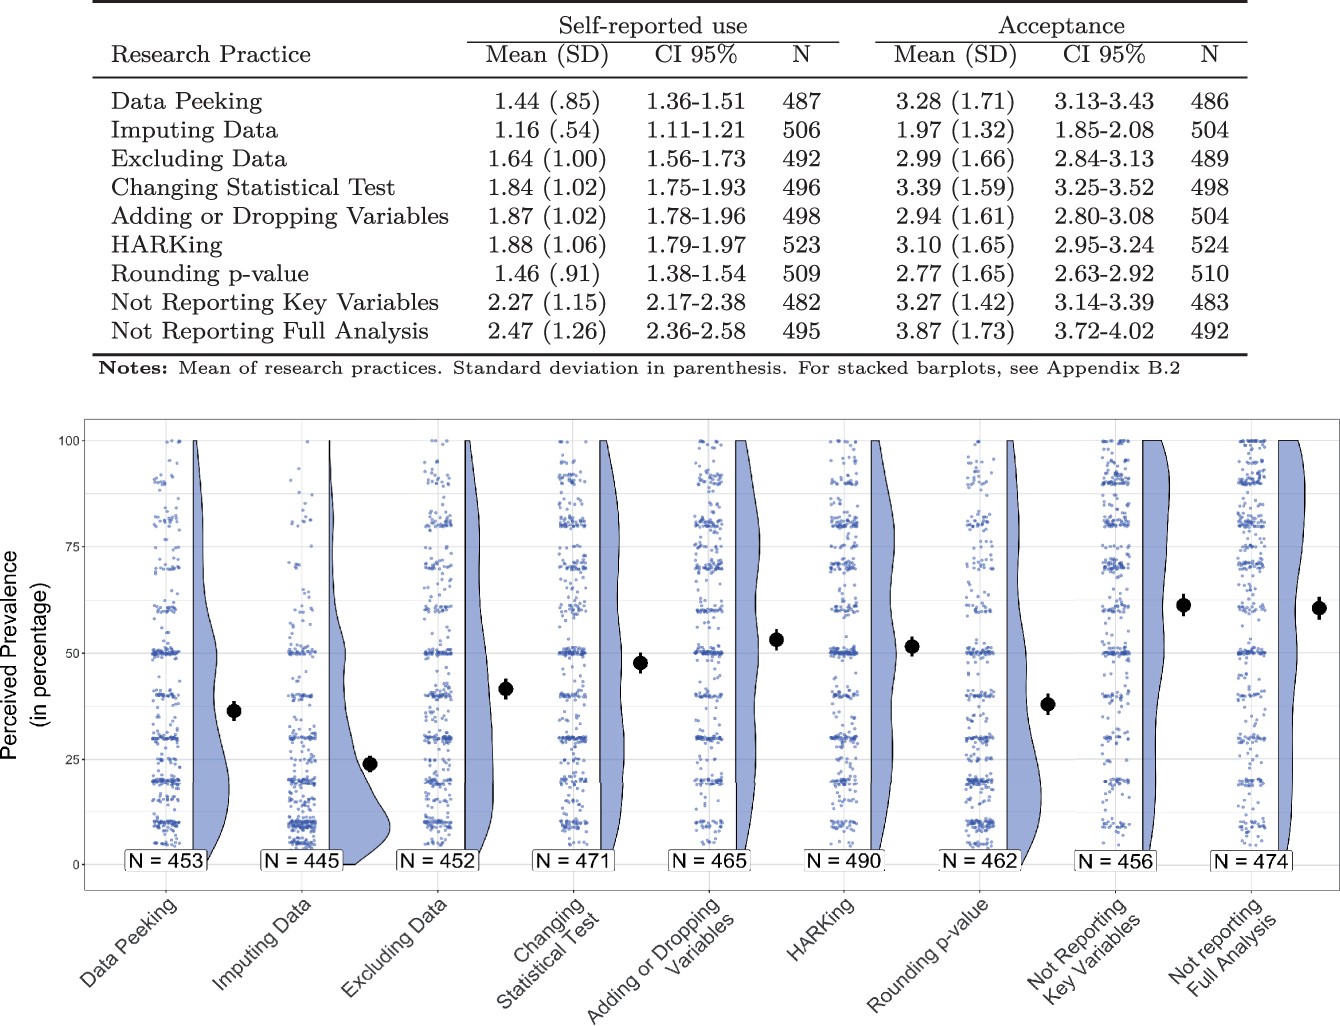
QRPs: Verbreitung in KW
QRPs: Verbreitung in KW
Fehler
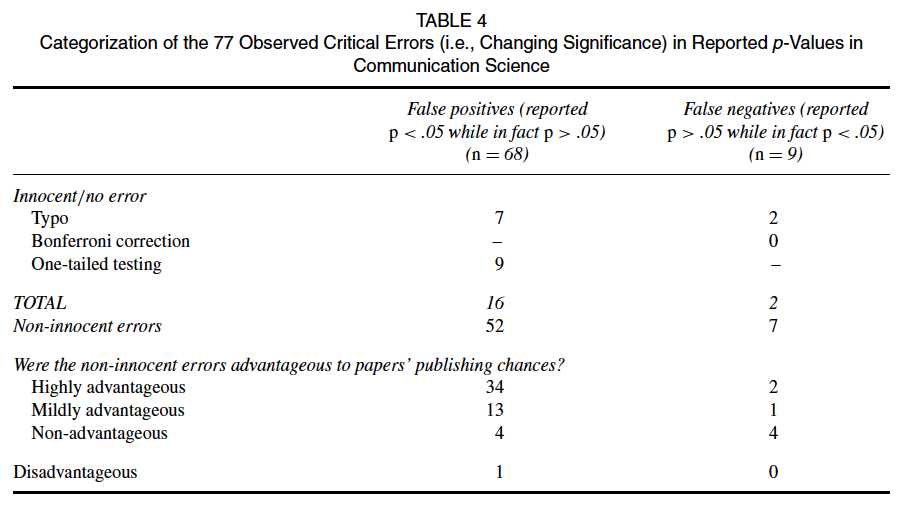
- Technische Fehler bei Datenmanagement oder Analyse (z.B. Codieren einer Variable)
- Fehler beim Berichten von Ergebnissen (Beispiel: falsche p-Werte)
- Einerseits: Irren ist menschlich.
- Andererseits: “hilfreiche” Fehler häufiger
- Unschuldige Erklärung: Wenn Ergebnis nicht “stimmt”, wird genauer geprüft
Publikationsbias

Entscheidung der Herausgeber:innen von Fachzeitschriften: Studien mit “statistisch signifikanten” Ergebnissen haben bessere Publikationschancen
Entscheidung der Wissenschaftler:innen: Studien mit nicht “statistisch signifikanten” Ergebnissen verschwinden in der Schublade (file drawer)
Betrifft unter anderem nicht erfolgreiche Replikationsstudien
Folge: Verzerrter Forschungsstand, selbst wenn die publizierten Studien unverzerrt sind
Warum Open Science?
OS als Reaktion auf Probleme
OS als Umsetzung wissenschaftlicher Prinzipien
Nachvollziehbarkeit als wissenschaftliches Grundprinzip

- Royal Society (1662): “Nullius in verba” (take nobody’s word for it)
- Abgrenzung von der Autorität von Institutionen (Kirche) oder Personen (König)
- Wissenschaftliche Ergebnisse müssen überprüfbar sein
- Voraussetzung: Transparenz und Veröffentlichung eines möglichst großen Teils des Forschungsprozesses
Weite Definition

Agenda for Open Science in Communication
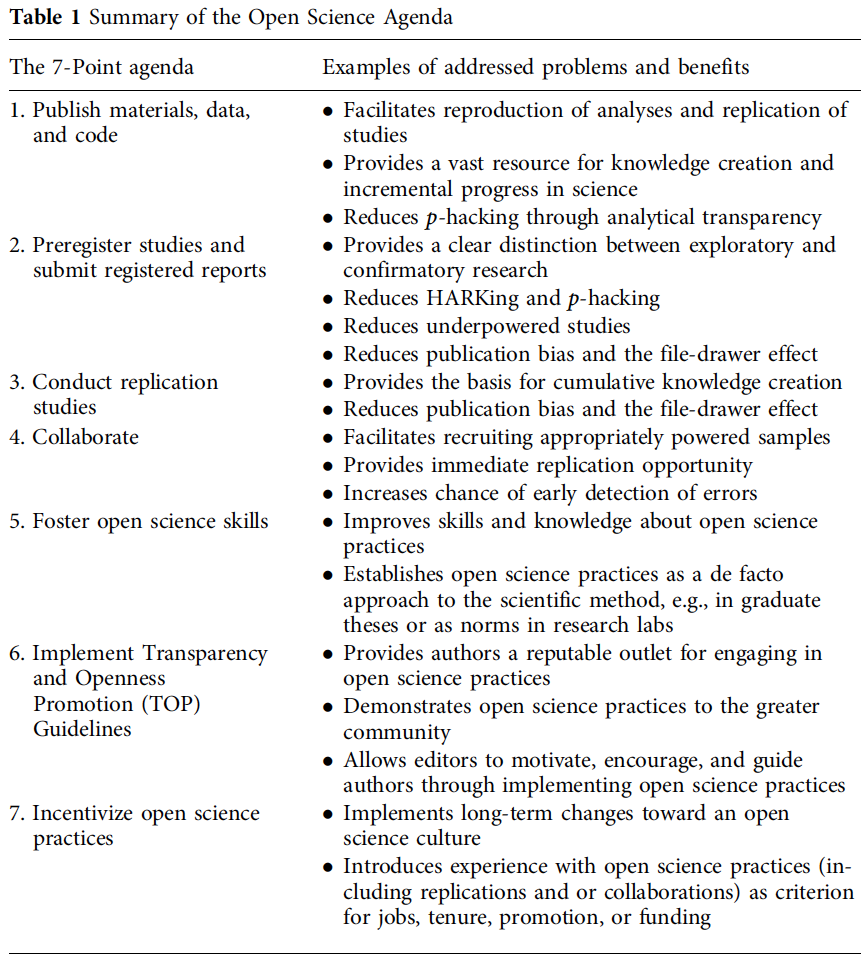
Open Science Praktiken

Präregistrierung
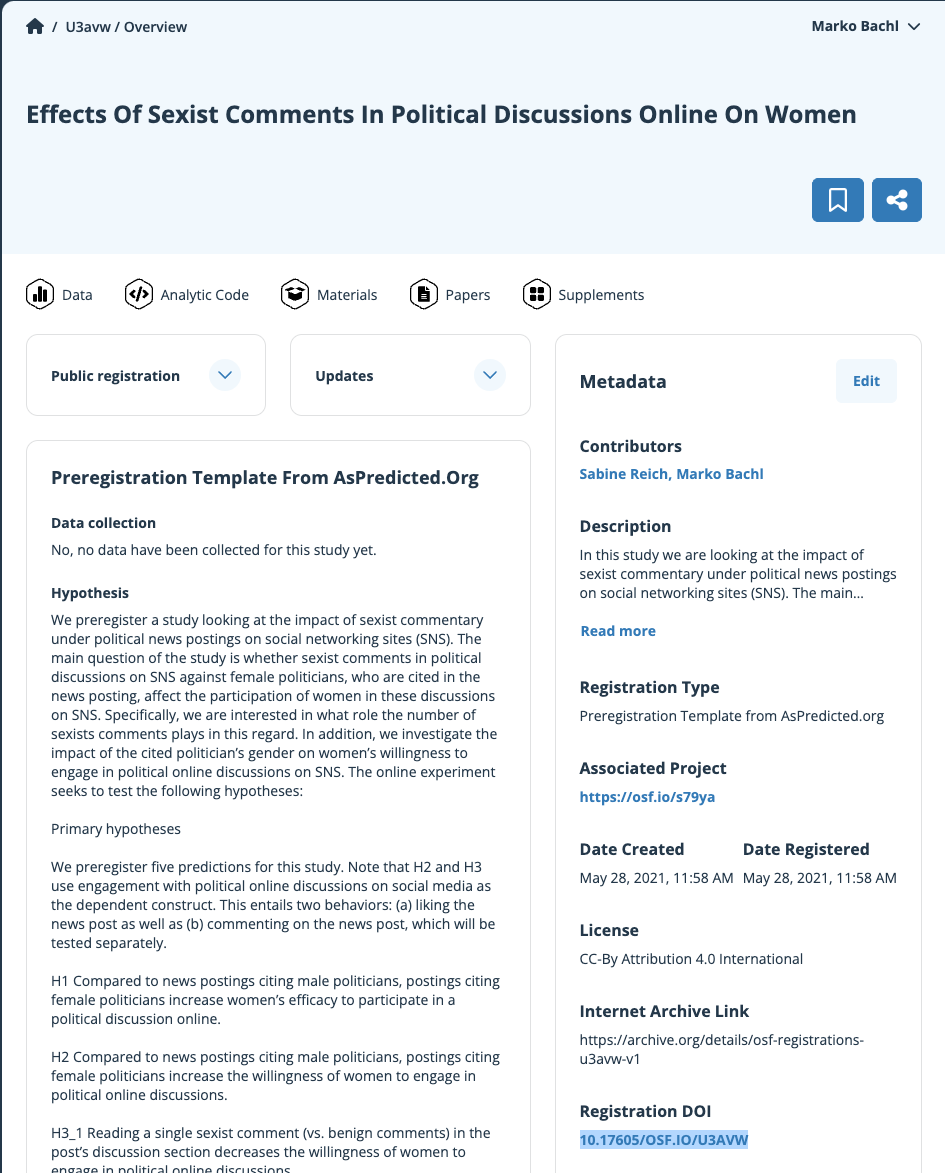
- Veröffentlichung von Hypothesen und Studiendesign vor der Datenerhebung
- So konkret wie möglich
- Gut: Öffentlich verfügbare Präregistrierung; anonymisiert im Begutachtungsverfahren einbringen.
- Besser: Registered Report (Einreichen der Präregistrierung, Verbesserung durch Begutachtungsverfahren, konditionale Annahme zur Veröffentlichung vor Studiendurchführung)
- https://aspredicted.org/: Einfache Präregistrierung
- https://osf.io/registries/: Viele Vorlagen
Veröffentlichung von Daten
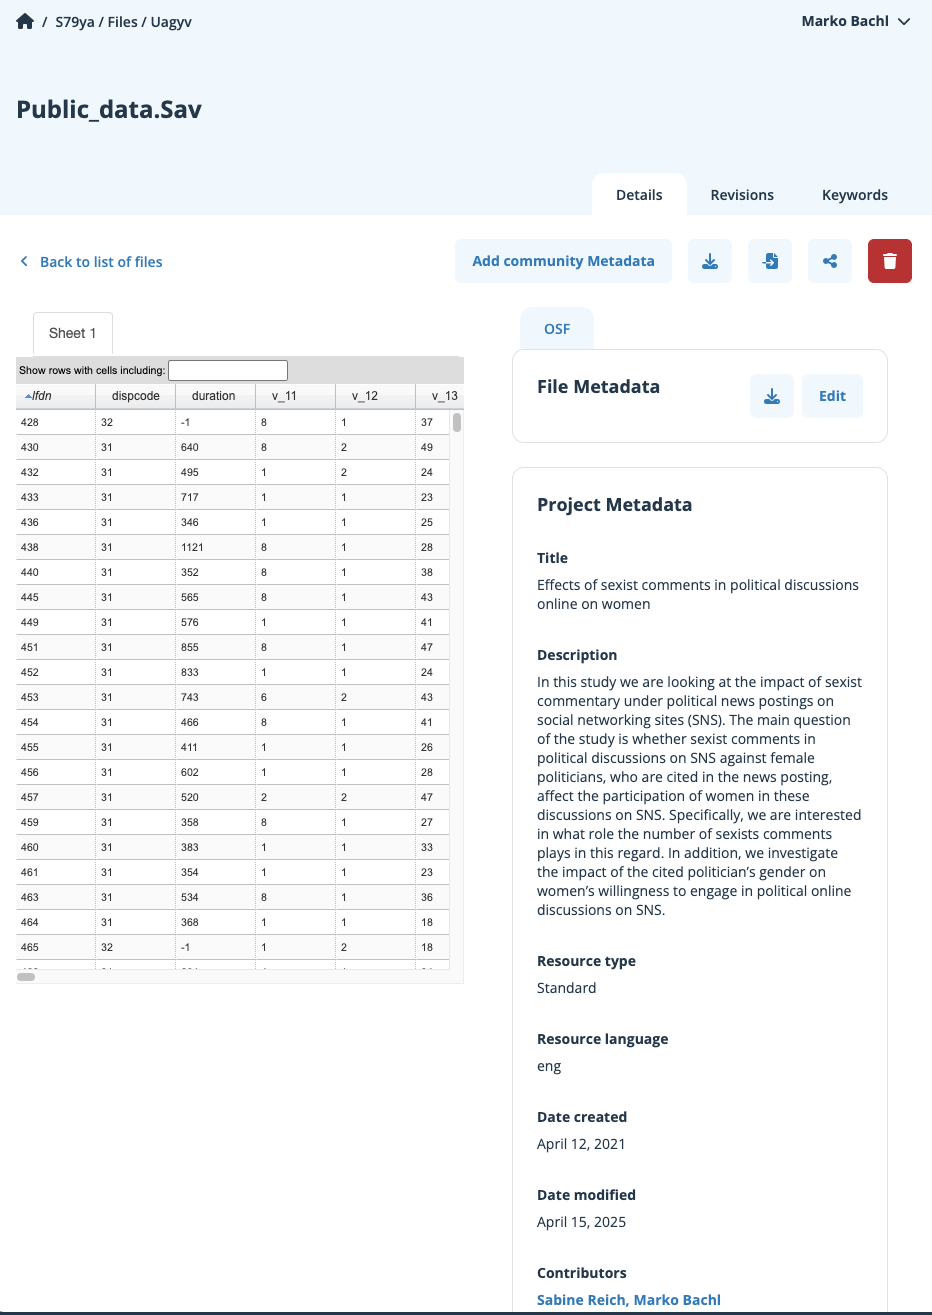
- Möglichst von Rohdaten bis zu Analysedaten
- Einige Daten können aus guten Gründen nicht veröffentlicht werden.
- “Among articles stating that data was available upon request, only 17% shared data upon request” (Hussey, 2025)
- https://osf.io/: Einfach, aber unübersichtlich
- https://dataverse.org/: Etabliert in Politikwissenschaft
- https://zenodo.org/: EU-Projekt
- https://www.gesis.org/datenservices/daten-teilen: Professionelle Archivierung sozialwissenschaftlicher Datensätze
Veröffentlichung von Material
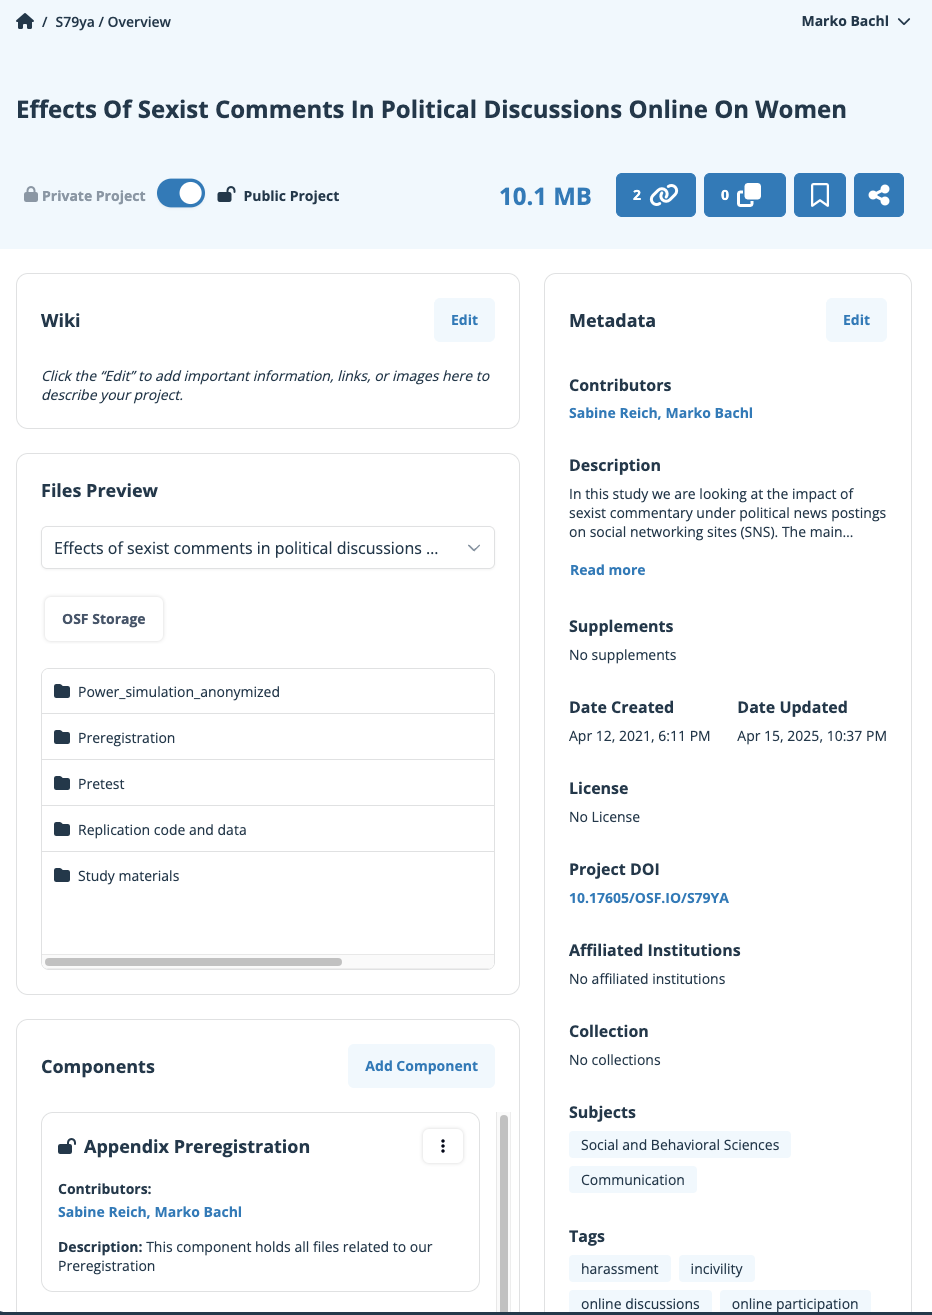
- Alles denkbare, teilbare Material, um Studie nachvollziehbar zu machen
- Planung: Vorstudien, Power-Analyse, Design
- Durchführung: Instrumente, Stimuli, Versuchspläne, Stichprobenpläne
- (Daten in verschiedenen Schritten des Forschungsprozesses)
- Analyse: Skripte zu Datenaufbereitung und Analyse