H. Burger, F. Birkenhake
Freie Universität Berlin, Malteserstr. 74 -100, 12249 Berlin, Germany
The main advantage of geostatistics is the fact that it allows the quantification of errors for any spatial estimate. This estimation error can be used for optimizing additional sampling efford, for classification of reserves or for analyzing the propagation of error during spatial GIS-operations. Geostatistical public domain software packages exist which offer standard and advanced kriging methods for local and global reserve estimation, but nothing comparable for the global estimation error. But confidence limits for the global mean are the basis for reserve classification: Along the horizontal axes of the well known McKelvey Box reserves are ordered according to decreasing geologic assurance of existence whereas the other axis shows the economic feasibility of their recovery.
In this paper a proposal is made which combines ideas from the very beginning of geostatistics and objective methods for estimating sampling accuracy using the unique tessellation of a 2D-domain by Voronoi polygons. A Visual Basic program is presented which demonstrates the capability of this approach with regard to global reserve estimation and improved sampling design in environmental research.
Keywords: Voronoi polygons, extension error, reserve classification, global estimation error
The main advantage of geostatistics is the fact that it helps to quantify the error of spatial estimates. During the early days of geostatistics elementary errors were of primary interest: most textbooks of this time contain numerous charts with graphs for the estimation variance and dispersion variance for various variogram models and different geometrical shapes of blocks. But the interest of modern geostatistical techniques (DK, IK, PK, SIMUL) focus on the estimation of local probability distribution functions which provide an improved (local) error analysis.
The global mean of a regionalized variable in a given domain can simply be calculated by taking the average value of kriging block estimates. Neighboring estimation errors are not independent because the corresponding block estimates are calculated using common data. Therefore another approach than kriging has to be applied to estimate the error of the global mean. Under certain conditions [1, Chapt. V] the practical calculation can be done by combining the elementary extension errors of all samples extended to their range of influence. These elementary errors can be estimated by the extension variance and combined for a global error. The practical solution contains two steps [1, 2, 3]: a) kriging of blocks and calculation of the global mean b) determination of the global estimation error. It is rather tedious to design, calculate and combine the various elementary error terms. Additionally this procedure depends on rather subjective choices of kriging method, blocksize, kriging neighborhood and error combination. All examples given are based on samples taken on a regular or random stratified grid.
During early stages of exploration in most cases only few, irregularly distributed data are sampled and local estimates are less important than objective information about the global mean and its confidence limits. A comparison of different exploration projects can only be made if common standards are applied. If only few data are available it seems to be more economic to use the well known polygonal method for estimating the global mean and its error. The extension of each data to its range of influence leads to a Voronoi tessellation of the domain. The influence of block size and location of block centre is thus eliminated. The polygons can be sorted in increasing order of their extension variances and suitable thresholds can be chosen for the definition of different reserve categories.
Keeping in mind the rapid progress in geostatistics it may be useful to re-examine basic geostatistical concepts which may allow the definition of standards for accuracy assessment in spatial estimation. This problem plays an increasing role not only in reserve estimation but also in environmental problems. The advent of geographic information systems (GIS) facilitates the analysis and interpretation of multivariate spatial data sets and it is a challenge for the geostatistical community to develop methods for spatial error handling in GIS.
The following chapters re-examine the "geostatistical" polygon method with respect to reserve classification and error handling in multilayered GIS.
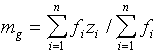
Let D be a domain where a regionalized variable Z is sampled. We assume that the geometrical shape of D is known exactly and a set of n values z(x i) (i=1,...,n) is measured. The Voronoi tessellation produces a set of polygons Vi with area f i (i=1,...,n). The (unknown) global mean zD can be estimated by a weighted mean of data values:
| |
(1) |
The extension error of each polygon is calculated by using a discrete version of
| |
(2) |
If the elementary error terms are uncorrelated , these errors can be combined to an estimate of the global error:
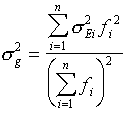 |
(3) |
where the summation is over all polygons Vi.
By convention we assume a normal probability distribution for the global error zD - mg (see [1], Chapt. V.C for critical remarks on this probabilistic model) and get 90% confidence limits for zD
| |
(4) |
The global estimation error decreases with an increasing number of samples (some local deviation from this tendency may occur due to large polygons). For an increasing number of samples the global estimation error converges to zero. This also holds in classical statistics (replace extension variance in (3) by sample variance), i.e. without reference to spatial correlation. Therefore this measure is not suitable for describing sampling density or reserve categories.
On the other hand the frequency distribution of extension variances gives valuable information about sampling density and homogeneity. Typical borehole patterns produce multimodal frequency distributions for the extension error which lead to natural categories of estimation accuracy (Fig. 2, 3).
This approach combines the following advantages:
Two major points of weakness of the polygon method are sometimes stated: Drilling information is not sufficient to define the geometrical shape of the ore body and unlimited choice of distance for constructing polygons sometimes leads to unreasonable extrapolation. But the first argument holds for any other method and the extrapolation can be avoided by using a predefined field boundary or to restrict the maximal radius to the range of positive spatial autocorrelation.
Several attempts were made to utilize geostatistics for reserve classification [2, 3, 4] but no international breakthrough was achieved. All classification schemes are modifications of a 2-dimensional matrix (e.g. McKelvey Box): From left to right the reserves are ordered according to decreasing levels of geological certainty, from top to bottom they are ordered according to decreasing economic feasibility (see Fig. 1).
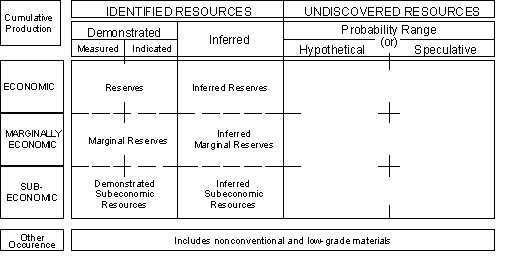
Fig. 1: McKelvey Box as an example of a classification scheme for mineral resources
Without going into details it can be stated that most reserve classes are defined by verbal expressions. An important step towards standardization was done by the GDMB (German Soc. for Metal. and Mine Workers, see [3,5]). Verbal descriptions are replaced by statistical measures based on geostatistical analysis. The definitions are summarized in Tab.1:
| Verbal category |
Level of probability |
Upper limit of error |
| proven |
90% |
+/- 10% |
| probable |
90% |
+/- 20% |
| possible I |
90% |
+/- 30% |
| possible II |
90% |
+/- 50% |
Tab. 1: Definition of reserve categories (adapted from [3] )
The block size - which is the basis for calculating the variances - is defined by the sampling grid and economic parameters ("core reserves" for the first 3 or 4 years of mining). This approach mixes information about the geological certainty of reserves with economic aspects which differ from one mineral to the other and from one mining province to another. Therefore it is desirable to keep both aspects separate and geostatistics can be applied to the "column-categories" of the McKelvey Box.
We can try to define the categories of geological certainty by using the polygonal method which presents information about the sampling design and the spatial variation of the sample values.
Let V={V1,V2,...,V n} be the set of Voronoi polygons obtained by tessellation of the domain D (Fig. 2).
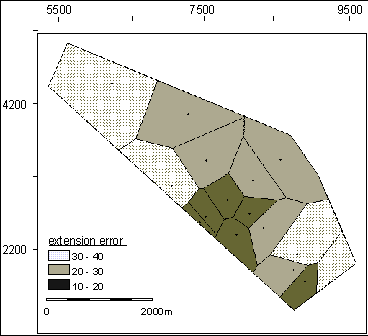
Fig. 2: Sample distribution and Voronoi polygons for an exploratory sampling
pattern of a
coal field in the Ruhrgebiet (Germany). Shading classes: extension error.
The histogramm of extension variances (or extension errors ) shows three peaks (Fig. 3). It can be expected that polygons with small extension variances belong to categories with higher geological certainty (this is similar to the approach of [4]). Therefore the definition of different reserve categories can be based on suitable thresholds for the extension variances expressed in percentage of the global variance (or in terms of percentage of standard deviation).
| Category A | |
(5A) |
where
![]() denotes the global standard deviation of Z
denotes the global standard deviation of Z
| Category B | |
(5B) |
etc.
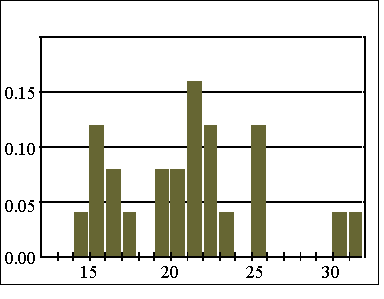
Fig. 3: Histogram of extension errors of Voronoi polygons for variable
thickness of coal seams.
The polygons can be displayed with different signatures for selected thresholds cA, cB etc. for seam thickness (Fig. 2). This allows an easy check for connectivity of polygons in a category and the reserves can be restricted to the maximal connected subset of V A, V B respectively.
The confidence limits for the global mean value mA within category A can be calculated using it's variance:
 |
(6) |
where the summation is over all polygons in region V A . The relative 90%-error for the mean value mA in this category is given by
| |
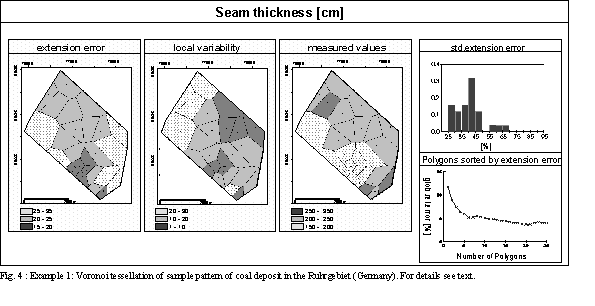
Example 1: Fig. 4 shows the same coalfield as in Fig. 2 extended by an exploration area in the north, where the distances between boreholes are close to the range of the variogram (spherical model: C=2400 cm2, a=1800 m). The standardized extension errors range between 25% for the smallest polygons and 70% for the largest ones (see right upper graph of Fig.4). Only a small area with seam thickness of the lowest class (see map of measured values) belongs to the (arbitrarily defined) first category. The global estimation error for this category can be taken from the graph in the lower right corner of Fig. 3.
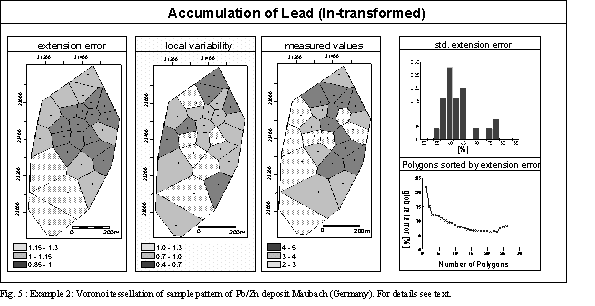
Example 2: Figure 5 shows the Voronoi polygons for the drillhole pattern of Maubach Pb-Zn-deposit. The log-transformed variable accumulation reveals a spherical variogram structure with nugget variance 0.2, sill=0.7 and range=190 m. The standardized extension error ranges from 55% up to 80% though the size of the polygons with respect to the range is comparable to Figure 3. Higher extension variances for accumulation are caused by the nugget variance which is ca. 25% of the total variance.
A similar figure can be obtained for the thickness of the orebody. The calculation of metal quantity requires additional calculations ([1], Chapt. V.C) because variables Pb and Zn are correlated.
It should be studied if the traditionally defined reserve categories allow a determination of threshold values c A, c B etc. which fit the given categories as good as possible. Geostatistics can offer objective and simple tools for classifying geological certainty. The "row categories" in the classification box must be defined by specialists of economic geology and mining
The problem of optimal location of k additional samples in a domain D with respect to some target function (i.e. minimization of the global error) is still unsolved. If a set of possible sample locations is given then it requires only repeated calculation of the corresponding target function in order to find the optimal solution. But this theoretical solution may not be accepted by the practitioner. In exploration practice the final decision on additional sampling is based on the following criteria:
The importance of these criteria may differ from one exploration project to another. In most cases additional sampling in rich zones of mineralization with high variability and low extension error will be preferable compared with poor zones and large Voronoi polygons which ought to be split in order to get a more homogeneous sampling pattern.
The local variability of Z centered in zi can be quantified by calculating the variance of z-values in neighboring polygons:
 |
(7) |
where the summation is over all sample values z j of neighboring polygons of Vi . A comparison of the spatial distribution of sample values, extension error and local variability seems to be a valuable tool for decision making in sampling design. The plot of the Voronoi polygons with signature classes for variable values and errors are a basis for the evaluation of the existing sampling pattern and support decision making for locating additional samples. From left to right the following plots are shown in Figure 4, 5:
Without going into detail and avoiding over-interpretation we can apply the above mentioned criteria for locating additional sample locations to the examples of the preceeding chapter:
Example 1: The thickness of coalseams (Fig. 4) increases from south to north but the local variability in this area is rather high. Therefore the high value in the almost rectangular polygon in the upper left part of the domain may be random and additional sampling in this area seems to be most important.
Example 2: Figure 5 visualizes the distribution of accumulation and corresponding error maps. Areas with high accumulation are densely sampled, but the local variability of these polygons is also high. The most promising area for additional samples (if the accuracy within the central part - plotted in the lower right - is sufficient) would be an extension of the central zone to the south.
Extension error and local variance can be combined (e.g. building a weighted sum) in order to visualize a generalized sampling error. This approach can also be applied to multivariate spatial systems which are analysed and combined using geo-information systems (GIS). Each regionalized variable is stored in a separate layer and various geometric, arithmetic and logic operations (union, intersection, sums, ratios etc.) are available for spatial modeling (e.g. in environmental risk analysis, resource management, favorability of mineral resources etc.). Different error types (position accuracy, thematic classification errors, digitization errors) affect GIS operations and various error models were proposed including fuzzy set, possibility, and probability theory [6].
The basis for analyzing error propagation in multivariate spatial systems is a suitable error measure for single variables which should reflect sampling errors, analytical errors, sampling density, sample support etc. For densely sampled variables ordinary kriging can be applied and kriging errors can be calculated and combined for evaluating the error of a target function.
For sparsely sampled variables the polygon method is preferable. (Some commercial GIS-packages contain Voronoi tessellation modules (e.g. ARC/Info) but no modules for error handling.) If all variables are analyzed using the same samples then the Voronoi polygons are identical and a generalized error term can be defined by a weighted linear combination of standardized error terms if they are independent:
| |
(8a), |
where denotes the estimation error of variable Zi (i=1,...,m). It is rather difficult to assess the total error if the variables are correlated:
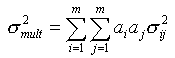 |
(8b) |
The error can be used to visualize the spatial homogeneity of sampling all variables in D and to control the quality of sampling at each stage of investigation.
If sampling density varies for different variables then an auxiliary grid can be superimposed onto each polygon pattern and the error combination can be performed on a regular grid (Fig. 6).
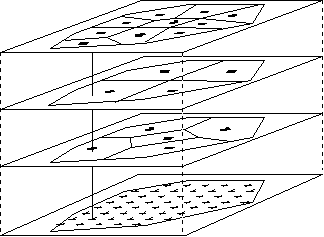
Fig. 6: Combining elementary errors based on differentsampling density for variables Zi (i=1,3).
If complex operations for building a target function are necessary, then the determination of the error terms is cumbersome and estimation of spatial errors and mutual correlations may become impossible. But it is better to apply a simple error model than presenting a map without any information about possible error limits.
The program consist of several modules which allow and interactive control, manipulation and display of spatial sampling patterns with respect to local and global error evaluation.
The program is a modification of a program developed by Dipl. Geol. J. Tietze for optimizing sampling for environmental problems. It is written in Visual Basic under Windows which facilitates graphical output and report making. Mouse clicks on one of the polygons opens a new window containing its characteristics: sample location, sample value, area of polygon, extension variance, local variance. Additional sample locations can be simulated. Comparison of corresponding global errors are possible which facilitate sampling design. Users are supported by online help. The program, test data and manual (in German language only) are available upon request.
Standard methods of global error estimation are based on kriging and combination of elementary errors which are assumed to be independent. In early stages of exploration it is very helpful to get a fast visual impression about the various errors connected with certain sampling patterns. A computer program is presented which is based on the geostatistical analysis of Voronoi polygons. This approach can be characterized by the following properties:
The first aspect is important for developing standards in reserve classification. The second may be useful for optimal samplig design and the third aspect can be a basis for error handling in geographic information systems.
[1] A.G. Journel and Ch.J. Huijbregts, "Mining Geostatistics", Acad. Press, 1978.
[2] R. Sabourin, "Geostatistics, as a tool to define various categories of resources," Geochautauqua on Comp. Appl. in the Earth Sci., Oct. 23-24 , 1981.
[3] GDMB (Ed.), "Klassifikation von Lagerstaettenvorräten mit Hilfe der Geostatistik," Verlag Chemie, 1983.
[4] P. Diehl, and M. David, "Classification of ore reserves/resources based on geostatistical methods," Can. Inst. Min. Met. Bull. 75 (838), 127-137, 1982.
[5] F.W. Wellmer, "Klassifikation von Lagerstaettenvorraeten mit Hilfe der Geostatistik," Erzmetall 36, p. 315-321, 1983.
[6] P. A. Burrough, "Principles of Geographical Information Systems for Land Resources Assessment", Clarendon Press, Oxford, 1986.